Table of Contents
You already track sales, ad spend, ACOS, and Buy Box. But there’s one deceptively simple question that most dashboards still don’t answer:
How much “shelf space” on Amazon do your products actually own and who is taking it from you?

That’s exactly what Share of Shelf inside SellerSonar’s Shelf Intelligence is built to show.
Shelf Intelligence in SellerSonar includes two core visibility metrics: Share of Shelf and Share of Voice. Together, they show how much of the digital shelf you own and how strongly you compete in sponsored placements. In this article we focus on Share of Shelf – the part of Shelf Intelligence that explains who actually occupies the space shoppers see on Amazon pages.
In the sections below, we will walk through what Share of Shelf means in SellerSonar, how it works in the product (with a real example), and how teams use it every day to protect and grow their Amazon revenue.
In SellerSonar, Share of Shelf tells you exactly what slice of an Amazon results page your products occupy versus your competitors. A “shelf” could be a keyword search like “organic coffee beans,” a category or subcategory page, or any other structured result set.
Instead of just wondering “Am I showing up?”, Share of Shelf answers, “Out of everything shoppers see here, how much space is mine and how much is theirs?” That way you’re not just guessing why sales dip or spike, you see who’s actually sharing the page with you and how often.
Share of Shelf was built to fix that. It reveals who really owns the digital shelf your customers see, turns visibility into a clear metric instead of a vague feeling, and helps you pinpoint where you’re losing or gaining space—so you can act before it affects your bottom line.
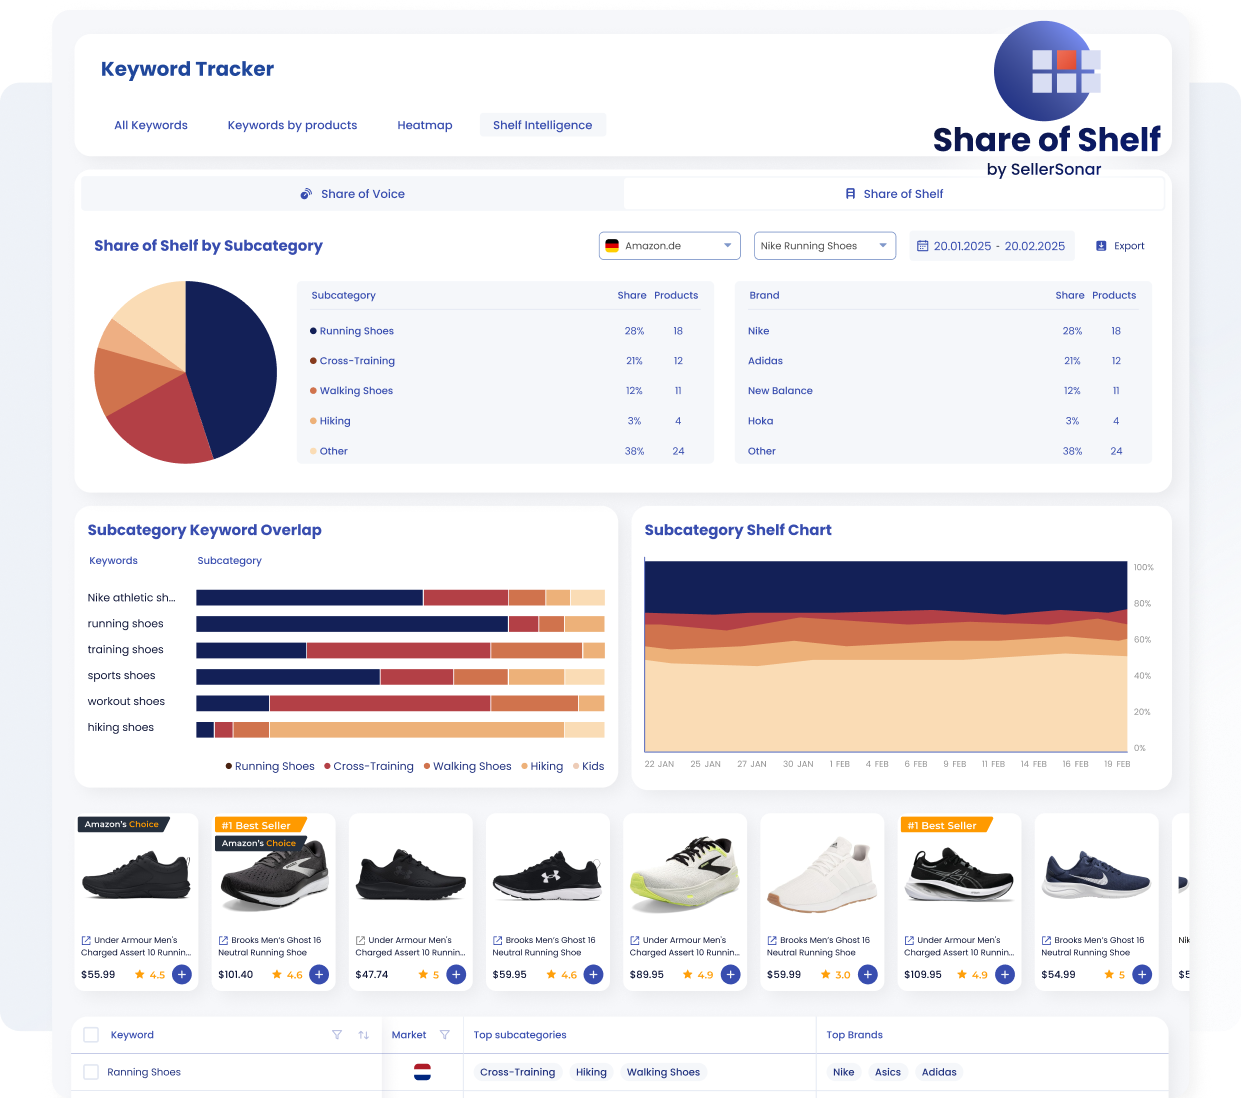
SellerSonar’s Share of Shelf dashboard outlines subcategory and brand distribution for running shoes and includes keyword overlap charts and product examples.
Below is an actual SellerSonar view for the keyword “Nike Running Shoes” on Amazon.de, with a date range of 20 Jan 2025–20 Feb 2025. All data is pulled live from Amazon by SellerSonar.
Share of Shelf by Subcategory
The donut chart on the left shows how the “running shoes” shelf breaks down:
- Running Shoes – 28 % (18 products)
- Cross‑Training – 21 % (12 products)
- Walking Shoes – 12 % (11 products)
- Hiking – 3 % (4 products)
- Other – 38 % (24 products)
This tells you that the main shelf for this keyword sits squarely in the Running Shoes and Cross‑Training subcategories. If you’re not strong in these two areas, you’re effectively missing out on most of the shelf, even if your products appear somewhere in the broader Shoes category.
Brand Breakdown
A leaderboard alongside the chart compares who really occupies this shelf:
- Nike – 28 % share (18 products)
- Adidas – 21 % (12 products)
- New Balance – 12 % (11 products)
- Hoka – 3 % (4 products)
- Other – 38 % (24 products)
This quick snapshot tells you which brands your products are actually competing against, not just who you think the competitors are.
Subcategory Keyword Overlap & Shelf Chart
The horizontal bars below show how each keyword (e.g., “running shoes,” “training shoes”) splits across multiple subcategories. For example, “running shoes” mostly lands in Running Shoes and Cross‑Training, while “workout shoes” is split more evenly.
On the right, the stacked area chart tracks how each subcategory’s share of shelf shifts over time. You can spot trends—like Cross‑Training gaining share in early February—and respond quickly.
What This Means for You
This single view tells you:
- Which subcategory is your real shelf
- Who currently owns it
- How each keyword spreads across subcategories
Armed with this, you can prioritise the right keywords and categories, focus your optimisation where it matters, and watch how your actions grow your share of shelf week by week.
Brand breakdown: who owns this shelf right now
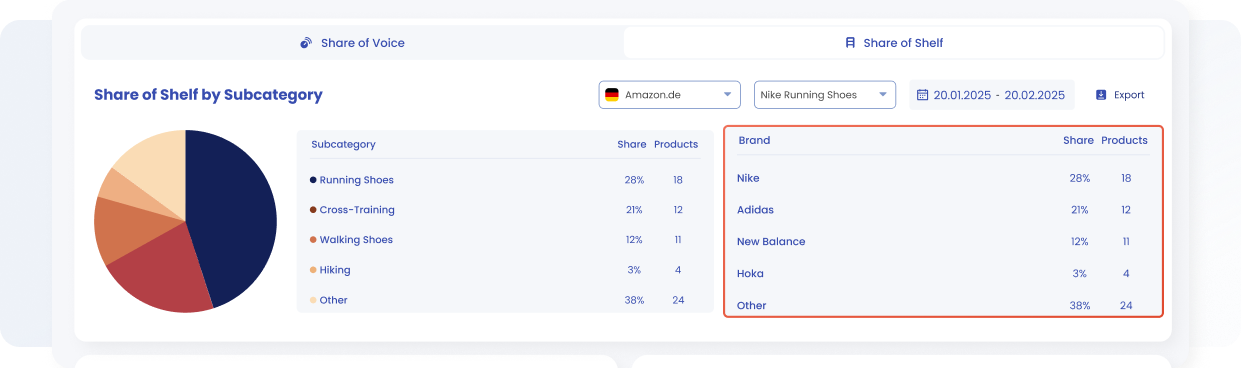
SellerSonar’s shelf intelligence dashboard highlights Share of Shelf across running shoe subcategories and brands.
On the right-hand side of the Share of Shelf view, SellerSonar displays a brand leaderboard for the same “Nike running shoes” shelf.
In seconds, you can see that Nike commands just over a quarter of this shelf, while Adidas and New Balance together occupy roughly one‑third. Smaller brands make up the rest. This snapshot gives you the real competitive picture: not just a theoretical list of rivals, but the brands actually sitting next to you on the same results page and taking away impressions and clicks.
Subcategory Keyword Overlap: how each keyword splits across shelves
The next widget, “Subcategory Keyword Overlap”, explains how each keyword in your set is distributed across subcategories.
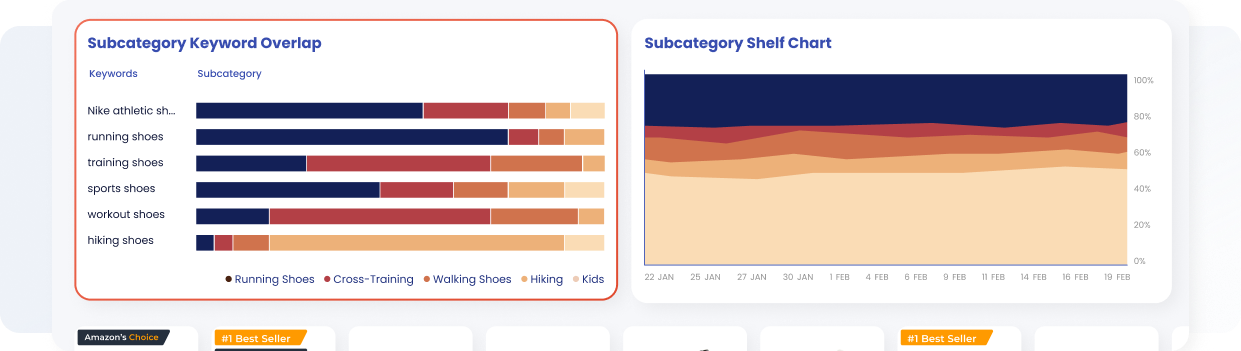
Charts illustrate how keywords map across running shoe subcategories and how share of shelf evolves over time.
- The Subcategory Keyword Overlap widget breaks down how each keyword spreads across subcategories. In the running‑shoes example, focused terms like “Nike athletic shoes” and “running shoes” land mainly in the Running Shoes and Cross‑Training categories. Broader terms such as “training shoes” or “workout shoes” are split across several categories.
- The stacked Shelf Chart shows how each subcategory’s share shifts over time — Running Shoes stay dominant, while Cross‑Training and Walking Shoes ebb and flow.
- SellerSonar does the counting and maths automatically, so you can see where your product sits and how much space each competitor occupies.
Summary: These widgets let you see which keywords steer shoppers to your shelf, decide where to compete and where to sit out, and track how your share changes week by week.
While Share of Shelf shows how much of the visible “shelf” is taken by your products and brands, Share of Voice focuses on your presence in sponsored placements and ad impressions.
In simple terms:
- Share of Shelf tells you who owns the page space customers see across organic and paid results.
- Share of Voice tells you who speaks the loudest in ads and sponsored spots for the same searches.
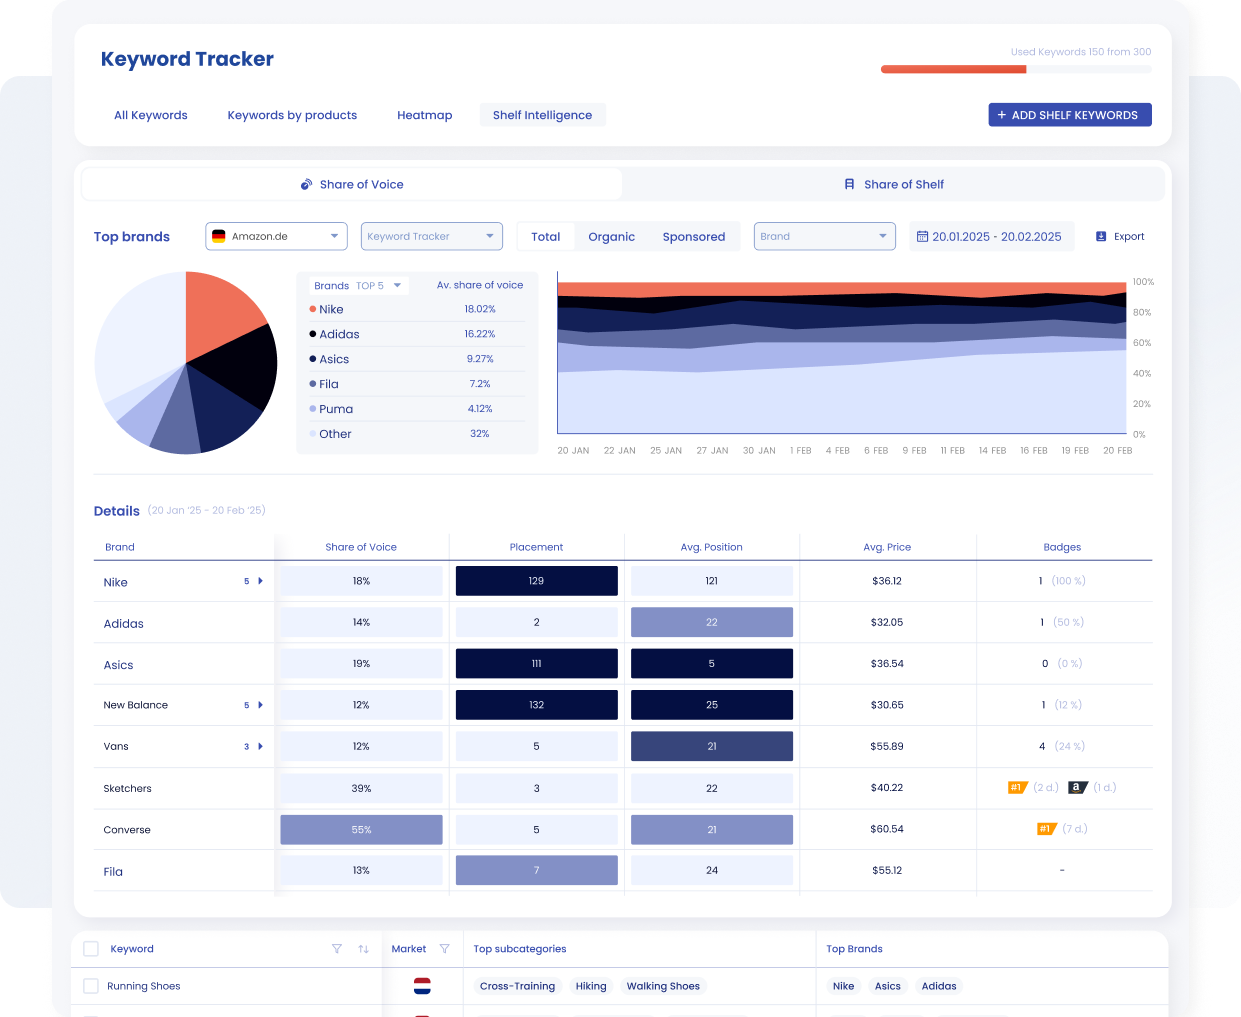
Example of the SellerSonar keyword tracker’s Share of Voice report, highlighting top shoe brands and detailed placement metrics.
Used together in Shelf Intelligence, they reveal different types of problems. For example, you can have high Share of Voice but low Share of Shelf – your ads are visible, but you do not own enough organic shelf space. Or the opposite: strong organic Share of Shelf but weak Share of Voice, which means you might be leaving paid visibility on the table.
Watch the tutorial: Now that you know who owns the shelf, learn who’s winning the sponsored placements. Our Share of Voice tutorial shows how to track ad visibility and compare brands over time.
If you want to explore how Share of Voice works in SellerSonar and how to combine both metrics in your reporting, check our dedicated Share of Voice guide.
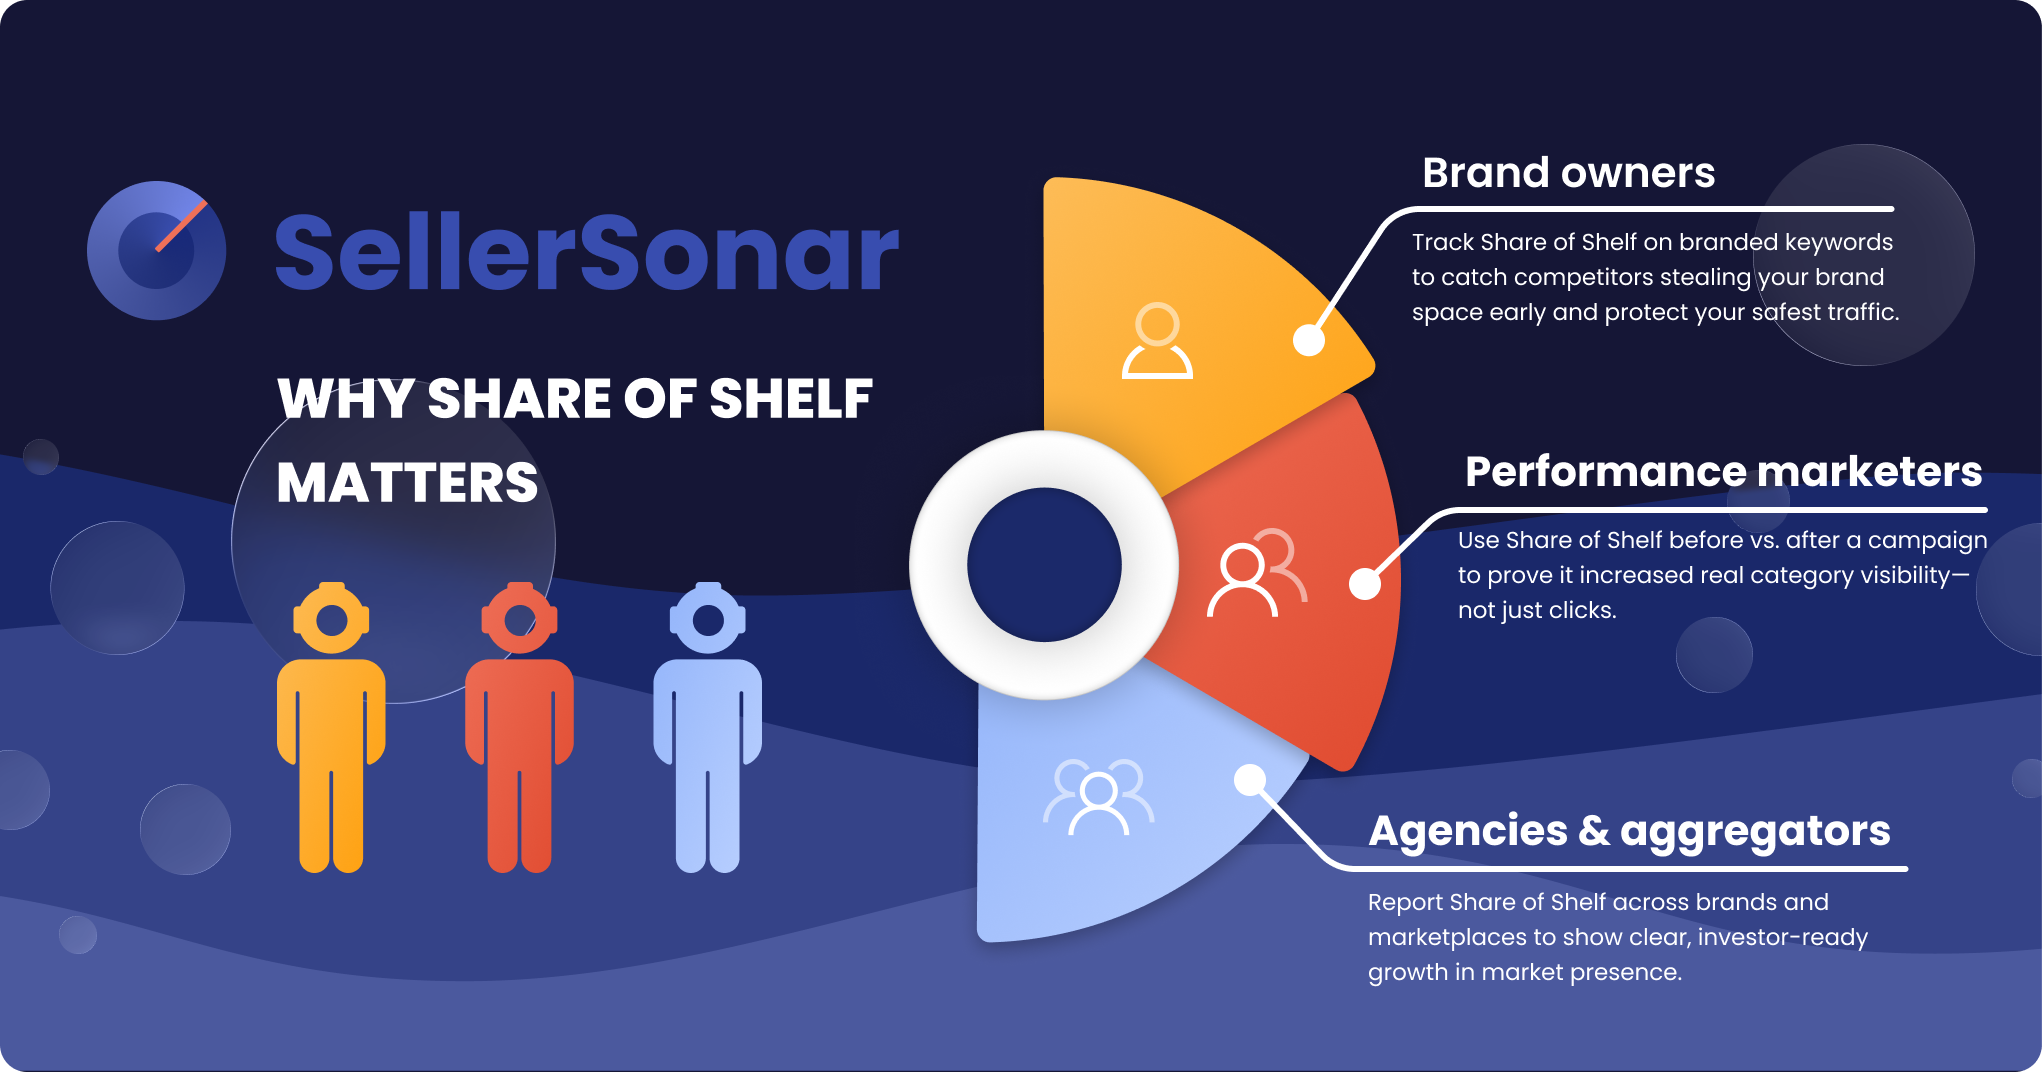
SellerSonar’s “Why Share of Shelf Matters” infographic illustrates how brand owners, performance marketers and agencies use Share of Shelf insights to protect branded keywords, demonstrate campaign value and report market share growth
Share of Shelf matters because it shows who actually occupies the space shoppers see, not just who gets clicks. When your Share of Shelf drops, competitors are quietly taking positions on your branded and category keywords even if your Buy Box or ACOS looks fine. With SellerSonar you can track that shift over time, spot where you are losing ground, and prove when campaigns or optimizations increase real category visibility, not just traffic.
Getting value from Share of Shelf does not require a complex setup. A simple onboarding flow looks like this:
1. Sign in or create an account
Share of Shelf is available on Business and Enterprise plans. Log in or upgrade to unlock it.
2. Connect your Amazon store(s)
Linking your store lets SellerSonar automatically pull live data for your products and competitors.
3. Build your Shelf Intelligence keyword lists
-
- Branded terms – protect your own brand keywords from competitors.
- Top generic revenue drivers – capture high‑value, non‑branded searches.
- Strategic categories/subcategories – track the spaces where you want to win.
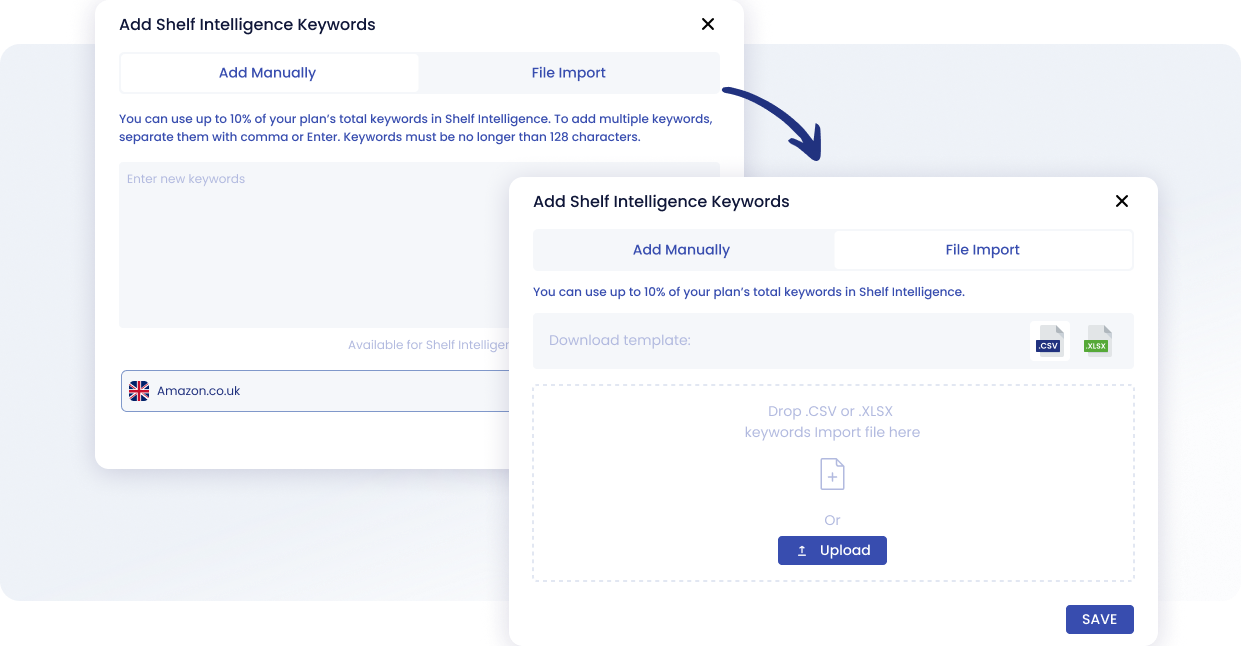
Interface for adding keywords to the Shelf Intelligence feature with manual input or file import.
4. Go to Shelf Intelligence → Share of Shelf
Here you can:
-
- Review your current shelf ownership by keyword and category
- Spot where your share is rising or falling.
- Set alerts when your share drops below a chosen threshold (e.g., 20 % on priority keywords).
- Save or export reports for your weekly or monthly performance reviews.
Turn Visibility into a controlled metric
Think of “Share of Shelf” as your Amazon visibility dashboard. Instead of guessing how much space your products occupy, SellerSonar measures it for you—showing the exact percentage of shelf space you own compared to competitors. This metric comes built‑in to Shelf Intelligence with trends, competitor breakdowns and easy reports, so you can:
- Protect your branded keywords from rivals
- Spot quick‑win opportunities in new categories
- Show the real impact of your campaigns
- Share clear, visibility‑focused reports with clients and stakeholders
That means no more waiting for sales to dip before you act. Take control of the shelf space where buying decisions are made, see your share for top keywords, and start growing your presence proactively.
Ready to see your share? Register for a free 14-day trial with all Business features or book a live demo to discover who really owns your Amazon shelf.