 Today’s buyers are busy people. However, the majority of them would like to make informed purchase decisions. Infographic is a good solution to this dilemma. It visualizes information that you will spend a lot of time reading.
Visual information attracts shoppers’ attention and makes it easy to understand complicated things. It turns the customer journey into an engaging experience. It helps quickly learn the essential features of your product and helps make a purchase decision. In other words, it helps increase sales.
Naturally, if you have a tool that helps grow sales and conversions, it would be strange not to use it. Using infographics with product images or as part of your A+ Content on the product detail page is a good way to talk shoppers into buying your product using visual effects.
Amazon infographics are aimed to visually stimulate buyers to make a purchase decision by highlighting the product’s features and making them easy to anticipate. It makes your listing “talk” to the customer.
By making it appealing, you get closer to the shopper and have better chances to convince buy. When created efficiently, infographics grasp customers’ attention with engaging visuals and help share your understanding of what a product you sell is.
However, if you don’t create infographics right, it may work the opposite way. It should be clearly structured and underline your product’s advantages and features.
Read this post to find out what is Amazon product infographic and how to create an efficient and eye-catching Amazon infographic design.
What Are Amazon Infographics?
Infographic is a set of images, icons, and other visual information created to deliver a clear and easy-to-understand message about a product to the shopper.
Infographics images are a good way to replace text blocks with images or drawings. Instead of reading through textual messages, a customer can get it immediately by just looking at the image, which saves their time and turns the customer journey into fun.
Since today’s shoppers would like to get information about a potential purchase in no time, this makes a point in using infographics on your listing.
You have plenty of space on your Amazon product detail page to use infographics. In addition to your main item’s image, six other images shouldn’t necessarily be products on a pure white background. You can fill one of these slots with infographics, while the rest you can use for text, graphics, icons, lifestyle imagery, and more.
You can’t always correctly showcase your product’s main benefits and features with images and pictures. Infographics can help you underline, compare, and deliver customer-specific analytical data that are pretty difficult to understand from the text. Also, you can save space and give additional information that you could not squeeze in bullet points but don’t want to add to the product description to keep it short.
Why Are Infographics Important?
Amazon infographics can help you in many ways. It grows conversion rates and sales volumes, reduces negative review rates, helps tell complicated things in easy visual language, and more.
Growing conversion and sales volumes
Clear and convincing visual information helps shoppers get a picture of your product fast and efficiently. It reduces shopping time and speeds up making a purchase. Also, it convinces the shopper that the ground for their purchase is an informed decision.
When a buyer is brought to your product page, you have minimal time to catch their attention and make them stay. Efficient infographics can elegantly convince you that what a shopper has landed on is the right choice without leaving a feeling of manipulation. It helps come straight to the point and highlight the advantages of what your customer is about to purchase. The more creative and convincing the infographics, the better the chance that a shopper will click the “Buy Now” button.
Reducing negative review rates
Misunderstandings about product information trigger most negative reviews, be it functionality, size, assembly instructions, and more. You can address specific product FAQs by creating a set of images with infographics. This way, you’ll avoid common misunderstandings since images are easy to anticipate.
Adding informative images describing product features also helps. Especially, pictures are good for showing the assembly instructions. You can arrange them as a step-by-step visual manual showing the assembly process.
It’s a good idea to review your product reviews before creating your infographics. This way, you can address major customer concerns and FAQs related to your product.
Increasing communication efficiency
When going through your listing, shoppers will definitely prioritize images compared to text. In most cases, they don’t go into the details of the product page unless they are interested in clarifying a specific issue. However, they will look at all images you added to the listing.
For that reason, infographics are a good place to highlight the item’s features, benefits, and other details.
Helps tell complicated things in easy visual language
There are helpful but boring pieces of information in your listing that shoppers are reluctant to read. These are technical product specifications, warranty information, size guidelines, and more. You can display those in the infographic format as a series of pictures guiding the buyer through the process.
A good example is assembly instructions. You can visualize all steps of the process, this way making it easier to anticipate. Also, you’ll arrange the pictures in a logical sequence so that the customer follows all necessary procedures.
This will reduce the return rates as well.
Accelerates decision-making process
Reading and understanding a piece of text takes time. The shopper often gets bored before they finish reading, even though the written info may be valuable. At the same time, images help immediately evaluate the information and talk the shopper into buying a product.
You simplify and accelerate purchase decisions with visuals highlighting the essential product features and benefits.
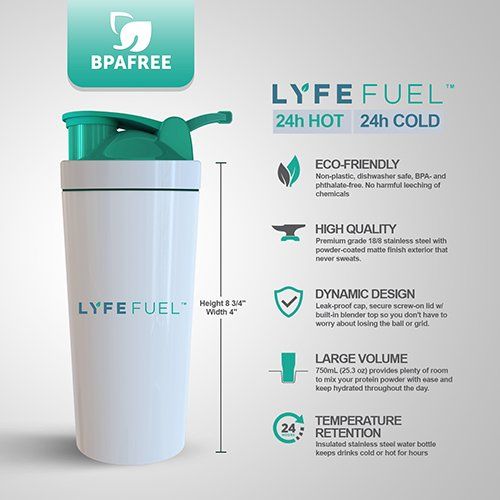
Example of Amazon infographics
Where Can You Sse Amazon Infographics?
You can apply infographics in two places on Amazon – in the product image section on your Amazon listing and the A+ Content if you’re eligible.
Infographics in the product image section
Typically, in the product image section on your listing Amazon allows you to feature up to seven images. You can replace one of the images with a video if you wish. Then you’ll add six pictures and a video.
However, depending on your product category, you can upload up to nine images to your listing. The first image should be of your product on a white background. The rest you can fill with infographics and pictures.
It’s a good idea to use all these slots. Big mistake sellers sometimes make is not using all spaces dedicated to pictures.
Adding a couple of images may not be enough to entirely understand what your product looks like.
Typically shoppers want to see a product from all angles to avoid misunderstanding. In addition, Amazon’s algorithm ranks the listings higher with more images because it considers them retail-ready.
Also, you can include creative infographics to complement images and add to the product understanding.
A+ content
Another location to add infographics is A+ content.
A+ content is an enhanced way to present your product description to shoppers. Using the A+ content, you can showcase your product features differently. You can tell a brand story, add more images and enhance product description.
A+ content is available to brand owners. To add A+ content, you must be a professional Seller registered as the brand owner through the Amazon Brand Registry Process. A+ content is also available for emerging brands, such as Launchpad and Amazon Exclusives, under specific selling programs.
A+ content is a great option for featuring infographics since it will help differentiate the product and gives a competitive edge.
Elements to Apply in Your Infographics
The main idea behind infographics is to educate your customer. Therefore, it should be informative, easy to understand, appealing, and target your audience.
For instance, if you sell electronics, infographics can illustrate the product’s features. On the other hand, if you sell toys, they should be bright, simple, and fun.
Tips for creating appealing infographics
Keep it informative
Highlight your product’s essential features and benefits or answer FAQs. Show dimensions, warranty and guarantee data, what’s in the box information, and product applications.
Make it attractive and elegant
Apply icons, creative colors, and typography to make your item stand out. Use 3D rendering.
Don’t overstuff it with information
Infographics shouldn’t be too complicated. Its idea is to keep things simple. Don’t overload it with extra-long or complex sentences. Use icons to make sure your images are easy to read and understand.
Add a lifestyle background
Infographic images on a lifestyle background help connect with shoppers and educate them simultaneously. Show how the product works, how it can be used, and how it fits everyday life.
Make the style of images and fonts consistent
The color, fonts, and visual effects should be consistent throughout all product descriptions or A+ content and complement your product. Use the same fonts everywhere.
For instance, let colors match your brand. If you sell beach mattresses, you can use blue and yellow colors that make customers reminiscent of the ocean and the beach.
Focus on your target audience
Think of your customer persona. Your infographics should reflect that.
You should use icons and fun images to sell toys and include minimum text. On the other hand, the photos must show safety precautions, how it’s used, and all technical parameters if you sell electric saws.
Don’t forget mobile customers
Nowadays, many people shop from their mobile devices. Remember that your infographics should also look appealing to these customers. It should be able to match all screen sizes.
To do that, keep your text short, apply icons and badges, and create a simple layout. Also, check how your infographics look on smaller screens.
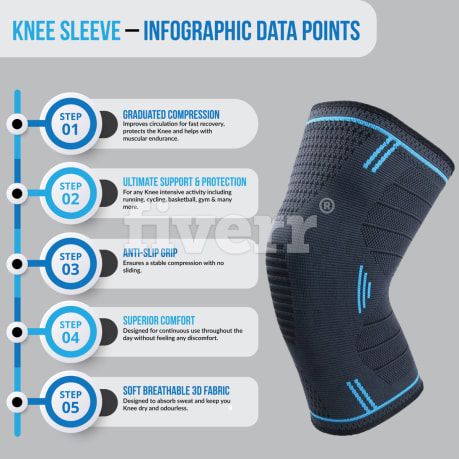
Example of Amazon infographics
Types of Featured Infographics on Amazon
The different types of infographic images should reflect the purpose of why you’re using them. It can be ‘what’s-in-the-box’ images, dimensions images, features and benefits images, and more.
Types of infographic images
- ‘what’s-in-the-box’ images – show what a package includes;
- dimensions images – display product height, width, and length;
- features and benefits image – outline complex information, benefits, and technical parameters;
- application scenarios image – show how your product can be used;
- assembly image – explain how to assemble the item step by step;‘
- ‘before and after’ image – that’s like when you show a lady with and without makeup; shows the consequences of using the product;
- warranty and guarantee image – let customers know about your warranty and guarantee policies;
- comparison chart image – show how your product differs from the others, but don’t compare it with a specific competitor.
How to Add Infographics to Your Product Listing
As said, there are two spots to add an infographic – product images and product description as A+ content.
Adding an infographic to your product images
Step 1. Log in to your Seller Central Account
Step 2. Find your product listing.
Step 3. Click the Edit button in the product listing tab in Seller Central.
Step 4. Click on Images, and add your infographics.
Adding infographics to your A+ Content
Step 1. Make sure you’re eligible for A+ content (Brand Registered).
Step 2. Access A+ content in your Seller Central.
Step 3. Clicking the Advertising tab at the top.
Step 4. Clicking A+ Content Manager and adding infographics.
Wrap Up
Visual information helps catch shoppers’ attention and simplifies the understanding of complicated things. When a buyer lands on your listing, you have a couple of seconds to convince them to buy your product. It’s challenging to achieve this goal with the text blocks, even though they are structured in the form of bullets.
This is where infographics come into play. It turns the customer journey into an engaging experience. It educates shoppers about a product and attracts their attention simultaneously.
Using infographics with product images or as part of your A+ Content on the product detail page is a good way to engage shoppers into buying your product using visual effects. Amazon infographics are aimed to visually stimulate buyers to make a purchase decision by highlighting the product’s features and making them easy to anticipate.
However, effective infographics shouldn’t contain too much information. It should be short and straightforward, including icons and other imagery, and target your product’s audience. If you don’t create infographics right, it may work the opposite way. It should be clearly structured and underline your product’s advantages and features.
Creating an optimized listing is vital, but merchants shouldn’t forget about their product performance. Amazon monitoring software is an efficient way to stay on top of your sales. SellerSonar offers instant Amazon alerts to protect your sales. With us, you are aware of all listing changes, Buy Box hijackers, new/deleted reviews, keyword rank history, and product suppressions.
Try SellerSonar now. Register for our 29-day trial and boost your incredible journey of running your business on the platform.