





 An Amazon sales estimator converts a product’s Best Sellers Rank into an estimate of how many units it sells per month. You give it a marketplace, a category and a BSR, and it returns an approximate monthly sales figure. It’s the standard way to size demand for a product you don’t own.
That’s the short answer. Below is how the estimate is actually produced, which tools are worth using, how far you should trust the number, and what to do once you have it.
What an Amazon sales estimator does
Amazon publishes a Best Sellers Rank on most product pages. BSR is a relative position within a category, recalculated hourly, and it reflects recent sales velocity weighted towards the last few hours and days. Amazon never publishes the underlying unit numbers.
Estimators close that gap by mapping rank to volume. Each tool builds its own mapping from a sample of products where it knows both the rank and the real sales, then reads your BSR against that curve. That’s why the same rank in the same category can return different numbers in different tools: they’re reading different curves built from different samples.
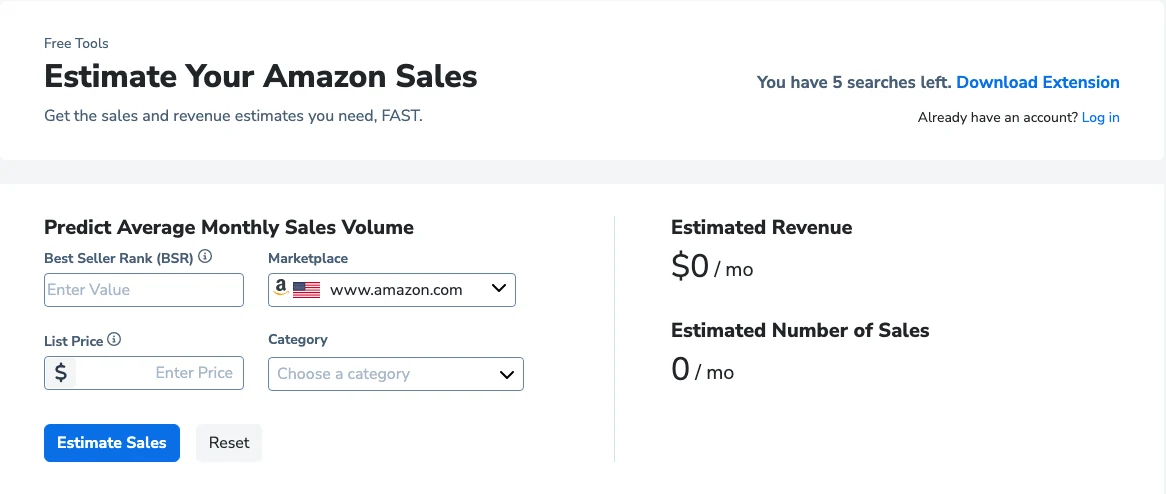
Rank, marketplace, price and category in; estimated monthly sales out
The category matters as much as the rank. A BSR of 5,000 in Kitchen and Dining is a very different sales volume from a BSR of 5,000 in a small niche category, because the rank is relative to how many products compete in that category and how fast they move.
How to check how much a product sells on Amazon
There’s no button on Amazon that shows another seller’s unit sales. What you can do is read the public signals and convert them. Three steps, and most sellers stop after the first.
Find the BSR on the listing
On a desktop product page, scroll past the description to Product information or Product details. Best Sellers Rank sits in that table, usually near the bottom. It shows one rank for the top-level category, then one or more much smaller ranks for subcategories.
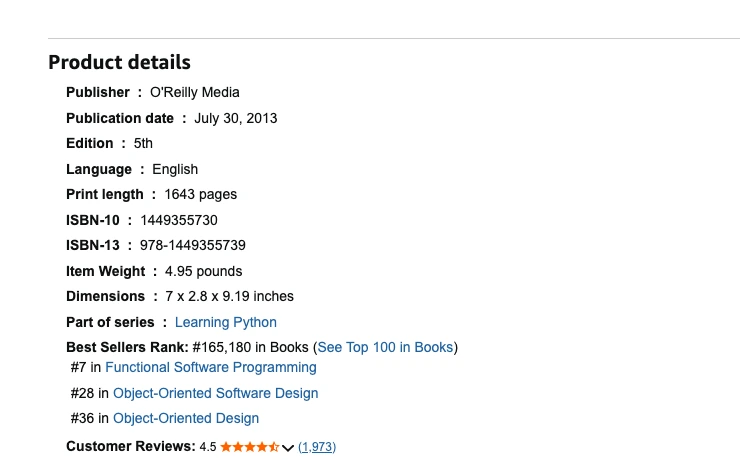
One listing, four ranks. #165,180 is the one an estimator wants
That difference is the most common way an estimate goes wrong. The top-level rank is the one estimators expect. A subcategory rank is drawn from a far smaller pool, so feeding it in as if it were the category rank turns a mid-table product into an apparent bestseller.
One more trap: on a listing with variations, the BSR usually belongs to the parent ASIN and covers every child. If you’re looking at one colour of a twelve-colour listing, the estimate you get covers all twelve.
Run the rank through an estimator
Take the top-level rank and its category into one of the free tools below. You’ll have a monthly unit figure in under a minute, and this is what most sellers mean when they talk about checking a product’s sales.
Run it through a second tool as well. Where two estimates disagree sharply, that disagreement is itself information: it usually means the category’s rank-to-sales curve is thinly sampled, and neither number deserves much confidence.
Check the rank holds up over time
A single BSR reading is a snapshot of the last few hours. A product can sit at rank 800 on a Tuesday because of one promotion and drift back to 40,000 by Friday. Watching the rank across a few weeks separates real demand from a spike you happened to catch, and it’s the step that turns an estimate into something you can act on.
Or use Amazon’s own demand data
If you have a Professional selling account, Product Opportunity Explorer reports search volume, click and purchase behaviour, competition and saturation, and pricing trends, grouped into niches rather than individual products. It won’t hand you a competitor’s unit sales, but it’s Amazon’s own data rather than an inference from rank, so for sizing a market it beats any third-party estimate.
The best Amazon sales estimators
| Tool | Cost | Inputs |
|---|---|---|
| Helium 10 Sales Estimator | Free, 5 searches without an account | BSR, marketplace, list price, category |
| AMZScout Sales Estimator | Free | BSR, marketplace, category |
| Jungle Scout Sales Estimator | Requires a Jungle Scout account | BSR, marketplace, category, optional ASIN |
| Product Opportunity Explorer | Free with a Professional selling account | Niche and category, not a single BSR |
Helium 10 Sales Estimator
The most generous of the free options. You get five searches without logging in, and it’s the only one of the three third-party tools that takes list price as well as rank, so it returns estimated revenue alongside estimated units. If you’re checking a handful of products, this is the fastest route. Our Helium 10 review covers what the paid suite adds beyond the free tool.
AMZScout Sales Estimator
A clean three-step calculator: pick the marketplace, pick the category, enter the BSR. It doesn’t ask for price, so it gives you units rather than revenue. Useful as a second opinion when a Helium 10 figure looks off, since comparing two independently built curves tells you more than trusting one. We’ve written up the wider toolset in our AMZScout review.
Jungle Scout Sales Estimator
Jungle Scout’s estimator now lives inside the app under Product Research, rather than on a public page. You’ll need an account to reach it. It takes marketplace, category and BSR, with an optional ASIN field. If you already pay for Jungle Scout it’s the natural one to use; if you don’t, the two above do the same job without a signup. See how the wider platform compares in SellerSonar vs Jungle Scout.
Product Opportunity Explorer
Amazon’s own tool, and the only one on this list not inferring anything. It reports what shoppers actually searched, clicked and bought, organised by niche, including unmet demand where search volume converts below the benchmark. It requires a Professional selling account at $39.99 per month plus selling fees. For validating a category before you commit stock, it’s the strongest signal available.
What we left out, and why
Two tools that appear on most older lists, including an earlier version of this one, no longer belong on it.
HelloProfit is seller analytics and PPC software for your own account. It reports your sales, not anyone else’s, so it can’t do the job a sales estimator does. Its site still carries a copyright notice dated from 2018.
Unicorn Smasher is still downloadable, but it has moved domains, lists a generic third-party support address, and doesn’t appear in Amazon’s own roundup of estimator tools. When a free tool’s provenance is unclear and it asks for an email before it does anything, the estimate isn’t worth the exchange.
How accurate are sales estimators?
Treat every figure as an order of magnitude, not a measurement. They’re reliable enough to tell a 50-unit-a-month product from a 5,000-unit one, which is usually the decision you’re making. They are not reliable enough to model a business plan on.
Four things pull the estimate away from reality:
Category depth. The rank-to-sales curve is steepest at the top of large categories. Near the top of a big category, a small change in rank is a large change in units, so a stale BSR reading distorts the answer badly.
Seasonality. A rank captured during Prime Day or the Q4 peak reflects that week, not the year. Estimators return a monthly figure whatever week you sample.
Variations. Many listings share one BSR across a parent ASIN with a dozen child variations. The estimate covers the whole family, not the single colour or size you were looking at.
Sample bias. Each tool’s curve is built from the products it has data on, which skews towards categories its own users sell in. That’s the main reason two tools disagree on the same input.
The practical way to handle this is to run the same BSR through two tools, take the lower number, and then check whether the rank holds up over a few weeks before you commit.
Estimating sales is only half the question
A sales estimator tells you how many units a product is likely to shift. It doesn’t tell you what you keep. Two products selling identical volumes can return very different margins once the referral fee, the fulfilment fee for that size tier, your cost of goods and your inbound shipping come off the top.
That’s the second calculation, and it’s worth doing before you commit to a product rather than after. Our free Amazon FBA calculator takes a selling price, your product cost and your shipping, and returns the fees and the margin left. If you’re not sure what to do with the output, our guide to using an FBA calculator walks through a worked example.
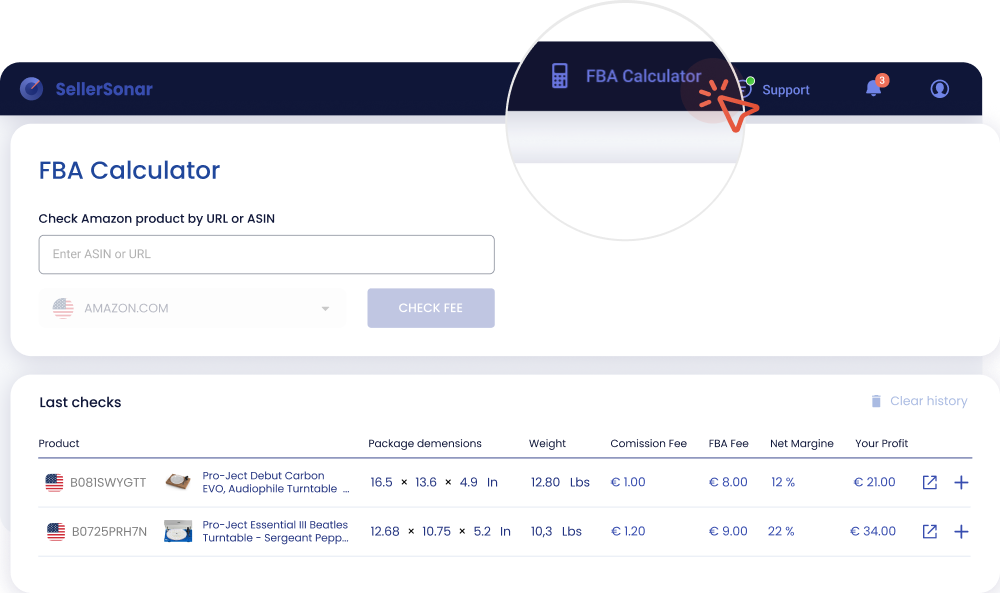
The other half of the sum: fees and margin per unit, by ASIN
Run the estimator for demand, then the calculator for whether that demand is worth having. A product doing 2,000 units a month at a two-dollar margin is a worse business than one doing 300 at fifteen.
A worked example, end to end
The figures below are illustrative rather than a real product, but the chain is the one to follow.
Say a listing shows a BSR of 4,300 in Home & Kitchen, priced at $24.99. Run that rank and category through two estimators and you might get 900 units a month from one and 650 from the other. Take the lower figure. That’s the discipline: the cost of overestimating demand is stock you can’t move, and the aged inventory surcharge that comes with it.
At 650 units and $24.99, that’s roughly $16,240 a month in revenue. Now the part the estimator doesn’t tell you. A 15% referral fee takes about $3,750. A standard-size fulfilment fee takes several dollars a unit. If your landed product cost is $7, that’s $4,550. Storage, returns and advertising come off what’s left.
The revenue line looked like a business. Whether the margin line does is a different question, and it’s answered by an FBA calculator, not an estimator. Run both before you place an order, not after.
From a one-off estimate to tracking over time
Estimating is something you do once, while deciding. Tracking is what tells you whether the decision is still right six months later, and it’s the part most sellers skip.
The same BSR that feeds an estimate is a live signal. When a competitor’s rank climbs steadily, they’ve found something: a price change, a new keyword, a promotion, a review push. When yours falls without your price moving, something happened to your listing. Neither shows up in a one-off estimate.

A year of BSR for one product and three rivals. The volatile line is why a single reading misleads
This is what competitor monitoring is for: watching a set of rival ASINs and their price, rating, review count and BSR together, so a move in rank comes with the reason next to it. An estimator answers whether a product is worth selling. Tracking answers whether it still is.
SellerSonar tracks competitor ASINs alongside your own and alerts you to listing changes, Buy Box hijackers, keyword rank movements and product suppressions. Start your free 14-day trial.

