





Quick Answer
Amazon competitor analysis is the process of identifying the rival ASINs that compete for your shoppers and comparing their listings, pricing, keywords, ads, reviews and Buy Box ownership with yours to find gaps you can win. Run it in 6 steps: identify competitors, audit listings, mine reviews, map keywords and share of voice, track price and Buy Box, then estimate sales.
Every product on Amazon shares its search page with someone else. The sellers next to you change prices, add images, buy sponsored slots and run deals, and none of them tell you before they do it.
This guide shows you how to run an Amazon competitor analysis step by step: how to find your real competitors, what to compare, which tools help, and how to turn what you find into changes to your price, listing and keywords. It also shows what tracked data reveals that a quick look at page 1 misses.
About the Author: Gloria Anderson writes for the SellerSonar editorial team about Amazon competitor research, pricing and the Buy Box. She checks every Amazon program detail in her articles against Amazon’s own pages, and the examples against live Amazon listings we track in SellerSonar.
What Is Amazon Competitor Analysis?
Amazon competitor analysis means studying the products that compete with yours for the same shoppers. You compare each rival’s listing, price, keywords, ads, reviews, stock and Buy Box with your own to see where they’re stronger, where they’re weak, and what you can change.
On Amazon, a competitor is a product, not a company. Each one has its own ASIN, and they fall into two groups:
- Direct competitors sell the same type of product at a similar price and show up on the same search terms. A 6-quart air fryer against another 6-quart air fryer.
- Indirect competitors solve the same problem a different way or at a different price point, like a 4-quart model at half the price.
Why Perform Amazon Seller Competitor Analysis?
Because your sales depend on decisions other sellers make. When a rival cuts its price, launches a coupon or takes the top sponsored slot on your main keyword, your conversion rate moves, even if you changed nothing. A regular analysis helps you:
- Price with context, knowing whether a rival’s discount is a one-day deal or a new normal.
- Improve your listing with what works on rivals’ pages.
- Find product gaps in their negative reviews.
- Spend ad money where it counts, on the terms rivals leave open.
- Spot threats early, such as a new seller, a stockout or a Buy Box change.
How to Run an Amazon Competitor Analysis in 6 Steps
Here’s the process at a glance. Steps 1 to 3 are research you refresh every few months. Steps 4 and 5 change daily, so they work best as ongoing tracking.
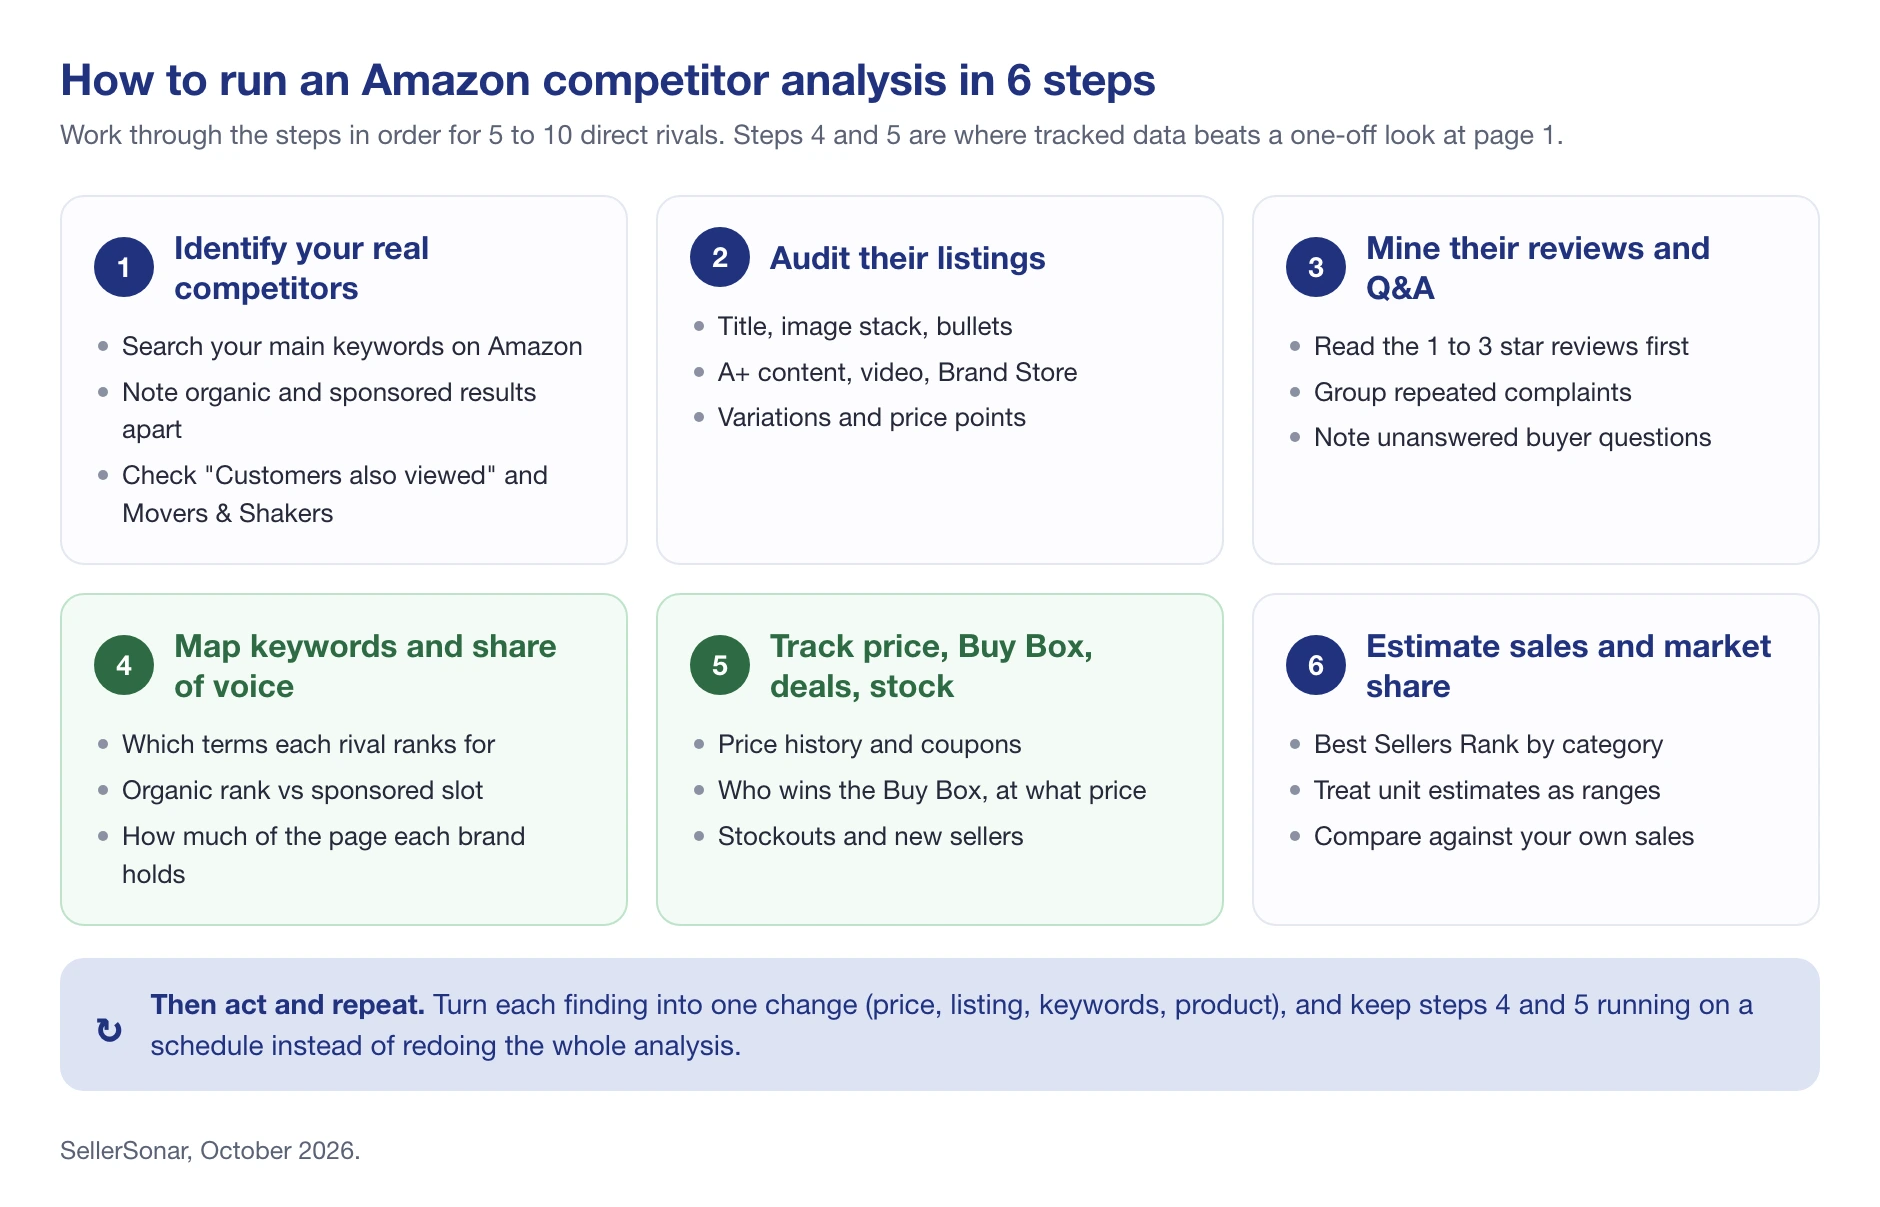
If you’d rather watch first, this short video shows how we monitor competitors in SellerSonar.
Step 1: Identify Your Real Competitors
Start where your shoppers start: Amazon search. Type your 3 to 5 main keywords and write down every product on page 1 that matches yours on type, size and price range. As you go, note two things:
- Organic vs sponsored. A product that only appears with a “Sponsored” label is paying for the spot. One that ranks organically has earned it.
- Variations. Two listings can be variations of one parent, sharing reviews and rank. Count them as one competitor.
Then widen the net with “Customers also viewed” on rivals’ pages and Movers & Shakers in your category. Cut the list to 5 to 10 direct competitors and a few indirect ones.
Step 2: Audit Their Listings
Open each competitor’s listing and read it the way a shopper would:
- Title: which keywords come first?
- Images: how many, and do they include lifestyle shots, size comparisons or infographics?
- Bullets: which benefits lead?
- A+ content and video: does the brand use the space below the fold? Our A+ Content guide shows what’s possible.
- Variations: which sizes or colors do they offer that you don’t?
For a quick score, run each rival’s ASIN through our free Amazon Listing Quality Checker.
Also click the seller name on the offer to see the seller’s storefront: which brands and how many products they stock. Brand owners with Brand Registry can also build a Brand Store with a short URL such as amazon.com/brand-name. It shows you their range, not their numbers: per Amazon Ads, Store Insights such as sales, visits and traffic sources go to the Store’s owner.
Step 3: Mine Their Reviews and Q&A
Reviews are the cheapest product research you’ll get. Read a rival’s 1 to 3 star reviews first and group the complaints: “coating peels”, “too loud”, “smaller than expected”. A complaint that keeps coming back is a gap your product or listing can close.
Do the same with the customer questions. Questions that repeat, or that nobody answered, show what the listing fails to explain, so answer them in your own bullets and images.
💡 Expert Tip: Keep a tally of complaints per rival. If three competitors share the same top complaint, you’ve found an improvement the whole category is missing, not just a weakness in one listing.
Step 4: Map Their Keywords, Organic and Sponsored
Keywords decide who sees which product. Start with the words in each rival’s title and bullets, then use a reverse ASIN tool, which takes a competitor’s ASIN and lists the search terms it ranks for. Helium 10 calls its version Cerebro, listed as “Discover Competitor Keywords” on its pricing page. Our Amazon keyword research guide covers the full process.
One caution about ad data. You can see where a rival’s sponsored listing appears, but not what it spends. Amazon defines ACOS as your own ad spend divided by your own ad sales, so any “competitor ACOS” is a guess. Track the sponsored position instead.
Once you know the terms that matter, track them daily for you and your rivals, organic and sponsored. A keyword rank tracker charts the positions side by side.
Then look at the whole page, not just rank #1. Share of voice measures how much of a keyword’s search results each brand holds. Here’s what it showed for “air fryer” on Amazon.com in SellerSonar.
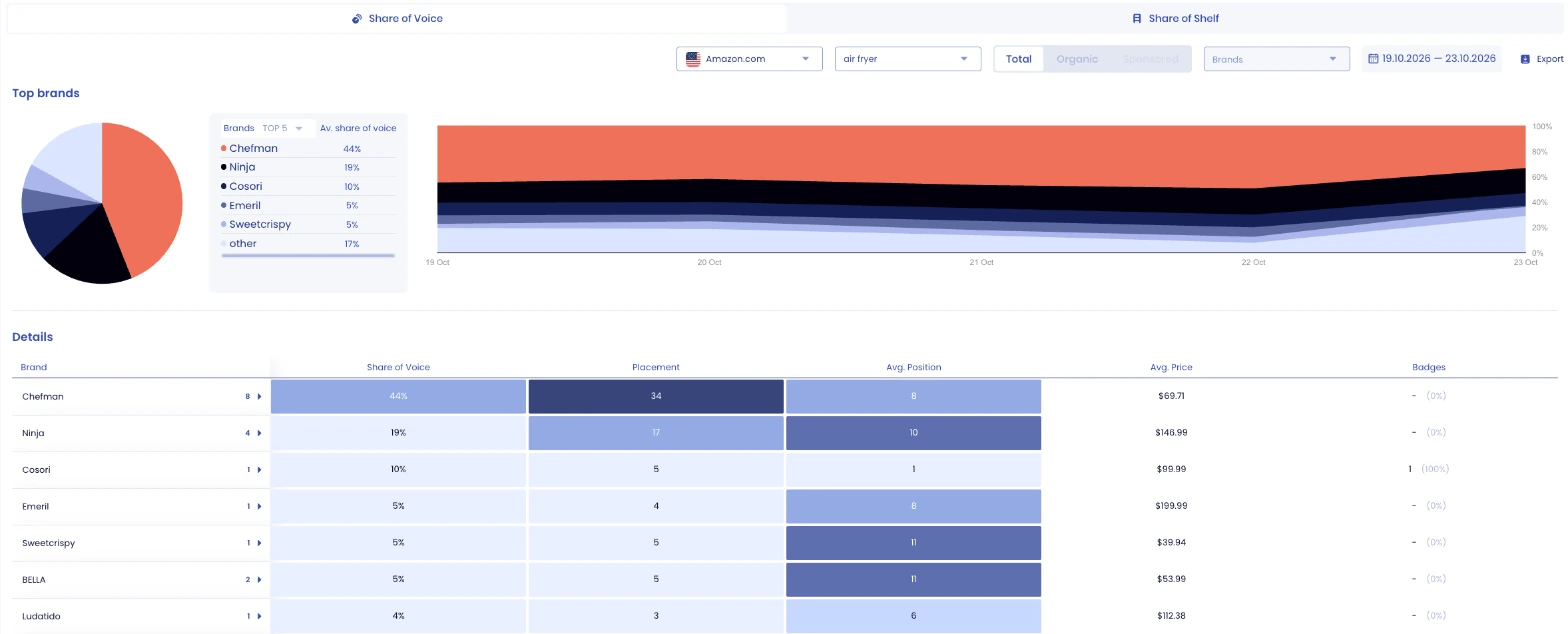
Per SellerSonar data, from October 19 to 23, 2026, the Cosori TurboBlaze held average position 1 for “air fryer”, but only 10% of the share of voice. Chefman held 44% with 8 products and 34 placements, and Ninja held 19% with 4 products. Our keyword tracking also showed a Chefman air fryer taking the #1 sponsored slot on October 23.
The #1 product owns one spot, while Chefman fills the page around it. Check only who ranks first and you miss the brand that holds the most space. Our guide to Amazon share of voice explains how to read these numbers, and Shelf Intelligence is where SellerSonar shows them.
Price is where competitors move fastest, so one snapshot tells you little. You need each rival’s price over time, next to its rank, reviews and keywords. This is the competitor table SellerSonar builds for the Cosori air fryer, with three tracked rivals.

The Ninja Air Fryer Pro AF142 sold at $124.95, 11% ($15) below its 7-day average of $139.99. That’s the kind of move you want to see the day it happens. To check by hand, our guide on how to see price history on Amazon lists the free options.
Next, check who holds the Buy Box on each rival’s listing, and at what price. The Buy Box seller gets the “Add to Cart” click, so on a shared listing the Buy Box price is the price shoppers see. Per Amazon’s Featured Offer help page, “As of September 2026, Amazon no longer maintains a seller eligibility requirement, and offers from all sellers are now eligible to be evaluated for the Featured Offer.”
SellerSonar’s Buy Box history for the same Ninja listing shows why this matters. On October 19 and 20, 2026, Amazon held its Buy Box at $139.99. From October 22, a reseller, KP Commerce, held it at $124.95 to $129.95. For anyone competing with that air fryer, the price to beat fell by about $15 without Ninja changing anything.
Finish with deals and stock. Note coupons, Limited Time Deal badges and Lightning Deals, and how often each rival runs them. When a direct competitor runs out of stock, its shoppers have to buy something else, and your ads and price can make sure it’s yours. Our explainer on how the Amazon Buy Box works covers what decides the winner.
🎯 Pro Insight: Track Buy Box share as a percentage over time, not just the winner on the day you look. A rival that holds it on every check at a steady price is a different competitor from one trading it with resellers every few hours.
Amazon doesn’t publish competitors’ sales, so you estimate them from Best Sellers Rank. According to Amazon’s guide to BSR, the rank is calculated from sales, recent sales count more, and BSRs “aren’t influenced by page views or customer reviews”. A product can hold several BSRs, one per category, and the rank differs between Amazon stores.
BSR is a rank, not a unit count. Sales estimators turn it into monthly units, each in its own way, so treat their numbers as ranges. See our comparison of the best Amazon sales estimators and our BSR guide. The trend tells you more than the number: a rival whose BSR keeps improving has found something, and steps 4 and 5 usually show what.
What to Include in a Competitive Analysis on Amazon
Put everything in one comparison sheet, with your own product in the first column and one column per competitor. Use this template as a starting point.
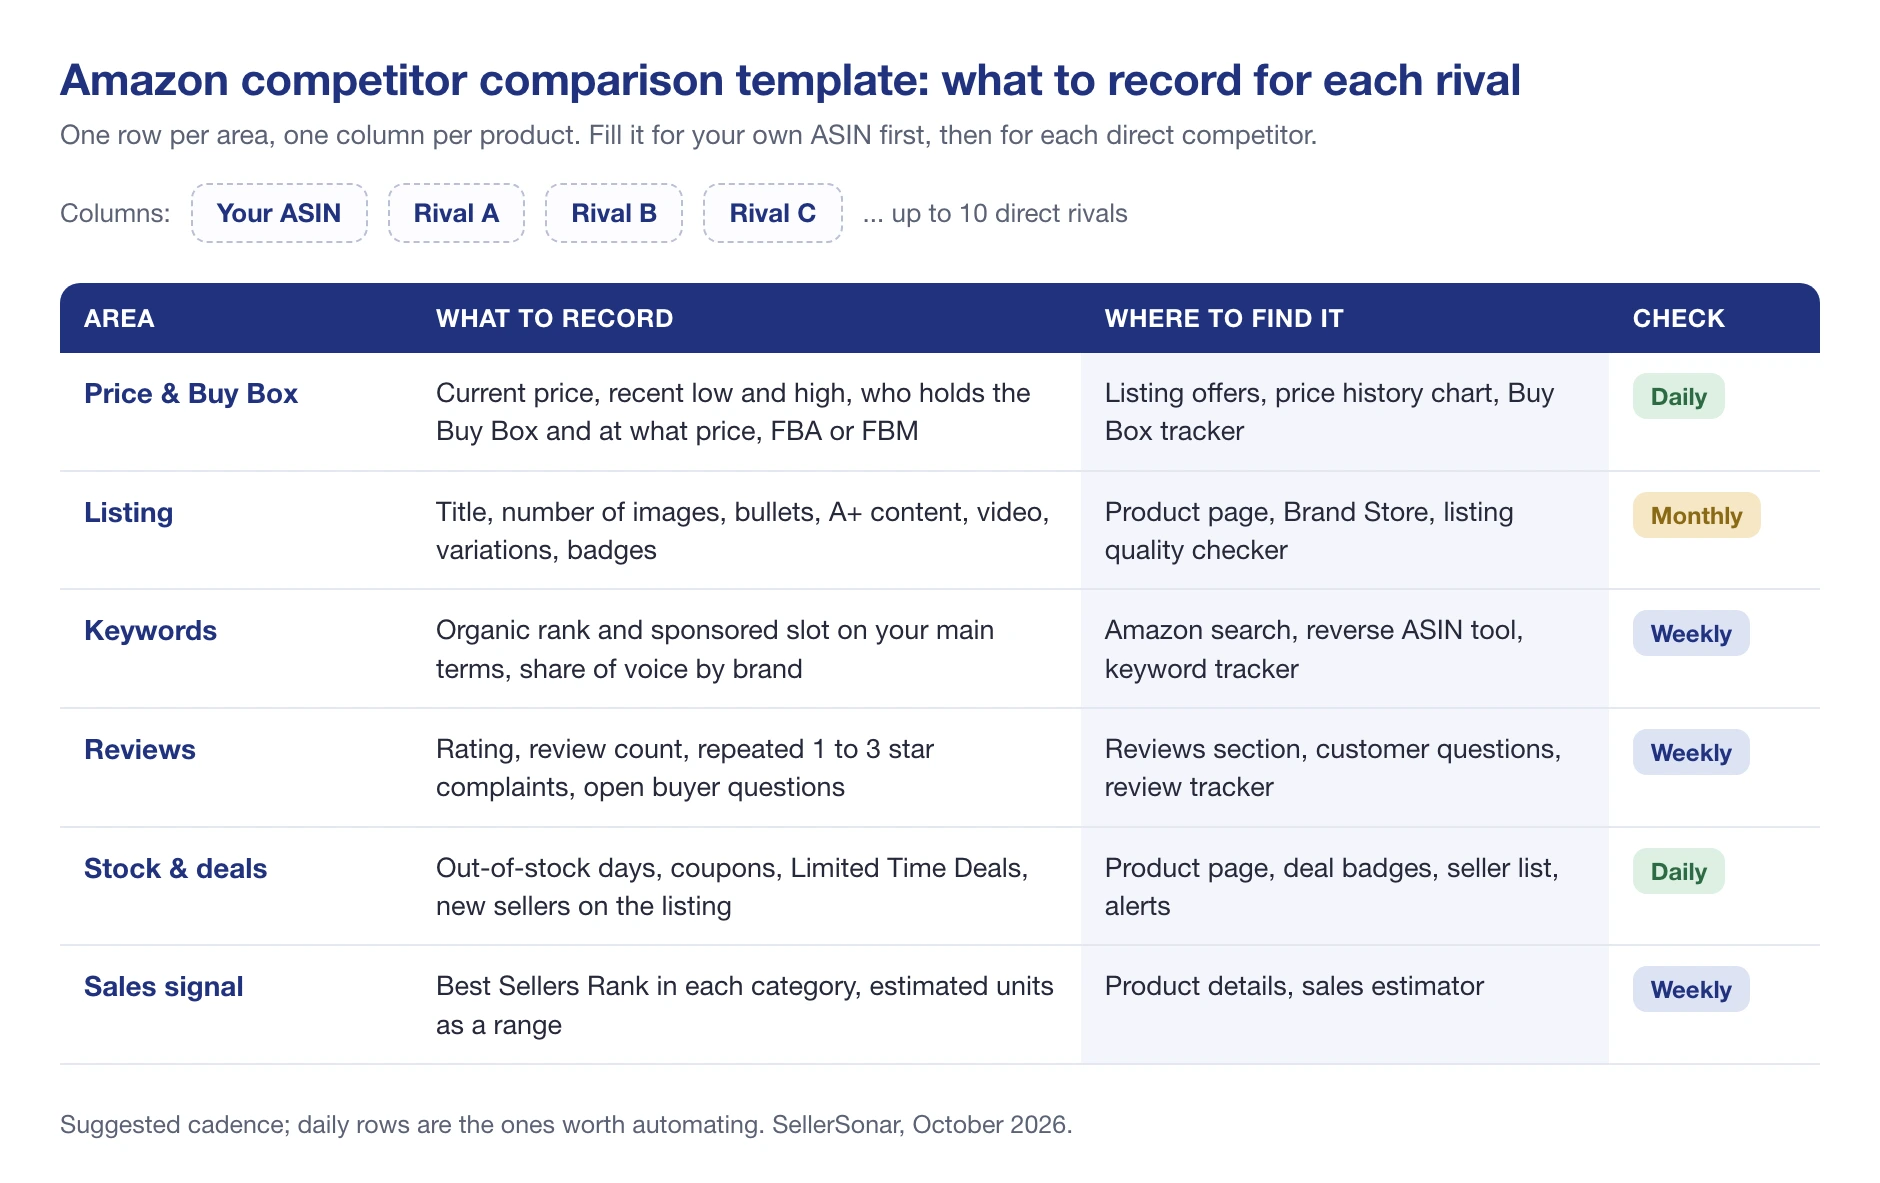
The daily rows go stale fastest, so fill the monthly rows by hand and let a tool keep the daily ones current. For your top 2 or 3 rivals, add two more checks:
- A test order. Buy their product to see how it’s packed, how fast it ships and who delivers it. Ask a pre-sale question first to see how fast they answer.
- Their business off Amazon. Check the brand’s website and social accounts: what they promote and which discounts they run outside Amazon.
How to Turn Competitor Data into Action
An analysis is only worth the changes it leads to. Here’s how common findings map to moves:
| What you see | What it usually means | What to do |
|---|---|---|
| A rival drops its price and keeps it there | A new price level in the category | Match, hold with a stronger listing, or compete on a different size or bundle |
| A reseller takes a rival’s Buy Box at a lower price | Shoppers see a cheaper offer than before | Check your margin before reacting; avoid a price war you can’t sustain |
| A rival ranks below you but holds more share of voice | It fills the page with more products or ads | Add sponsored coverage on that term, or a second variation |
| The same complaint repeats in rivals’ reviews | An unmet need in the category | Fix it in your product and say so in your title, bullets and images |
| A rival goes out of stock | Its shoppers need another option | Raise bids on its main keywords and make sure you’re in stock |
How Often to Monitor Your Competitors
A competitor analysis isn’t a one-time project. A practical rhythm:
- Daily: prices, Buy Box, deals, stockouts and new sellers. Automate these.
- Weekly: keyword positions, share of voice, ratings, BSR trend.
- Monthly: listing changes, new images or A+ content, new variations.
- Every quarter: repeat step 1 to catch new entrants.
Nobody checks 10 rivals by hand every day. SellerSonar checks tracked listings every 4 hours on Pro, every 2 hours on Premium and every hour on Business and Enterprise, and sends an alert when a check finds a change. The plans comparison lists what each plan includes.
Amazon Competitor Analysis Tools
There’s no single best competitor analysis tool for Amazon, because the job has two halves: research (who your rivals are and what they rank for) and monitoring (what changed since the last check). Prices below were last verified on October 23, 2026.
| Tool | Best for | Notes |
|---|---|---|
| Amazon search and product pages | Steps 1 to 3 | Free, but shows only the moment you look |
| Amazon Brand Analytics | Top search terms and the brands behind them | Needs a Professional selling account and a brand in Brand Registry |
| Product Opportunity Explorer | Niche demand and competition | In Seller Central, Professional plan ($39.99/month + selling fees) |
| Helium 10 | Reverse ASIN keywords (Cerebro), competitor products (Xray) | Platinum $129/month, or $99/month billed yearly |
| SmartScout | Brand and seller research | From $49/month (Basic) |
| SellerSonar | Ongoing monitoring of price, Buy Box, keywords, share of voice and reviews | No Seller Central connection; free 14-day trial |
If you qualify, start with Amazon’s own tools. Brand Analytics has a Top Search Terms dashboard showing the “top three products, categories, and brands associated with each keyword”. Product Opportunity Explorer groups search terms into niches and shows demand, “competition and saturation”, reviews and return activity. SmartScout’s plans run from $49 to $299 a month, and our roundup of the best Amazon product research tools compares more options.
Competitor Analysis with SellerSonar
SellerSonar handles steps 4 and 5, the parts that change every day. Add a competitor’s ASIN next to your own product, and SellerSonar tracks its price, BSR, reviews and rating, keyword positions and listing quality. It reads public Amazon pages, so you don’t connect Seller Central, and it covers 23 Amazon marketplaces.
The comparison card puts two products side by side. Here it compares the Ninja AF142 with the Cosori air fryer from the examples above.
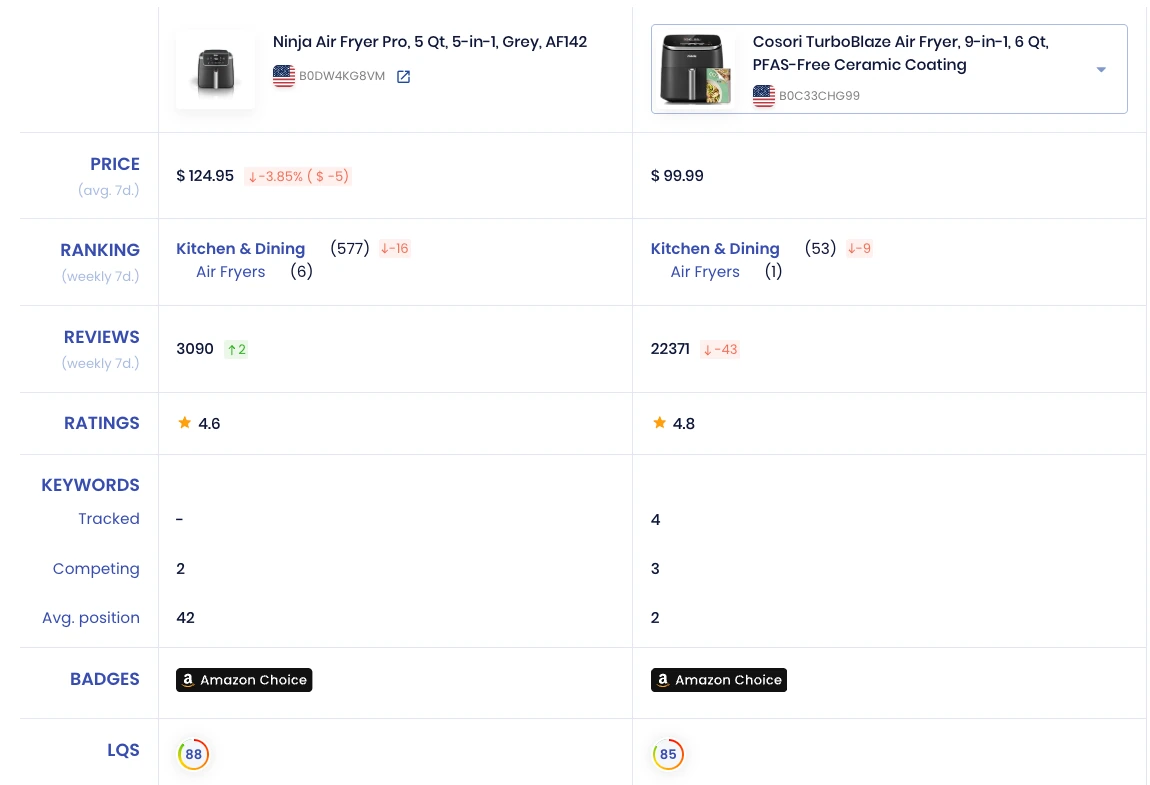
In this SellerSonar view, Cosori ranked #1 in Air Fryers with 22,371 reviews at 4.8 stars, and the Ninja ranked #6 with 3,090 reviews at 4.6. Yet the Ninja had the higher listing quality score (88 vs 85), so Cosori’s lead comes from reviews and rank, not a better page.
Other SellerSonar features that help:
- Keyword tracking with your organic and sponsored positions and your rivals’ on one chart.
- Share of voice by brand for tracked keywords, on Business and Enterprise.
- Buy Box monitoring: who held it, for how long and at what price, with won and lost alerts from Premium up.
- Listing change alerts for titles, images, bullets, new sellers and BSR moves. Several sellers can submit changes to one product page (Amazon weighs them by selling role, per its detail page rules), so content can shift without the brand’s input.
- Competitors on any marketplace: add rivals on marketplaces you don’t sell in yet, or on their own without linking them to a product, and review them all in one list. It’s the quickest way to size up a market before you enter it.
- Review tracking on every plan, collected through the SellerSonar Chrome extension with an Amazon buyer account signed in and the marketplace tab open.
- AI questions about your data: on the Business and Enterprise plans and in the free trial, the SellerSonar MCP lets you ask Claude or ChatGPT which tracked competitor cut its price.
See all features on our Amazon competitor monitoring page, or watch the video guide to monitoring competitors.
📌 From Our Experience: The competitor that hurts you most is rarely the one at #1. It’s the one you didn’t track: a reseller undercutting a rival’s Buy Box, or a brand quietly filling the page with variations. Track the whole first page for your main keywords, not just the leader.
Common Mistakes in Amazon Competitor Analysis
- Watching only who ranks #1. Rank shows one spot; share of voice shows who owns the page.
- Treating BSR estimates as facts. Compare trends, not exact unit numbers.
- Trusting “competitor ACOS” figures. Only the advertiser can see them.
- Doing it once. Prices and the Buy Box change daily; an old spreadsheet describes a market that’s moved on.
- Copying the cheapest price. Matching every cut starts a price war. Compete on listing, product and bundles first.
Putting Your Amazon Competitor Analysis to Work
A good Amazon competitor analysis answers three questions: who you really compete with, where they beat you, and what you’ll change because of it. Steps 1 to 3 give you the picture, and steps 4 to 6 keep it current.
Final Expert Recommendations: Pick 5 to 10 direct rivals, fill in the comparison template once by hand, and act on the two or three biggest gaps. Then automate the daily rows: prices, Buy Box, deals and keyword positions. Review share of voice weekly, because the brand filling the page around you can matter more than the one ranked above you.
If you’d like to see your competitors’ prices, Buy Box and keyword positions in one place, try SellerSonar free for 14 days (5 ASINs and 10 keywords, no credit card).


Still confused. Should try this in practice perhaps….
Hope to apply this additional knowledge in my amazon assistant journey.
Thank you – great overview! Very clean and to the point with no fluff.
Great blog. I’m new and it help me understand some path.
Thanks for sharing the article. It is very helpful. Nowadays I’m working on competitor analysis, I thought there was something missing but now after reading this guide it seems that it will be very helpful for me.