






Halloween 2026 falls on Saturday, October 31, and about half of US buyers start shopping in September or earlier.
That’s the part most sellers get wrong. They treat Halloween as an October event, tune up their listings around the 10th, and wonder why the first two weeks of the season went to somebody else. Meanwhile the Amazon Halloween best sellers lists have been sorting themselves out since late August.
This isn’t a gift guide. It’s what the 2026 demand data says about which categories are worth your inventory, when buyers actually show up, and what tends to break on a listing right when traffic peaks. All the numbers below come from the National Retail Federation’s annual consumer survey, and I’ve linked the source so you can check them yourself.
About the Author: Alex Harrison writes for the SellerSonar editorial team on Amazon search, monitoring, and seasonal selling. He spends most of Q4 watching what happens to seller listings when traffic triples within two weeks, which is a less festive job than it sounds.
The 2026 number, and what it actually tells you
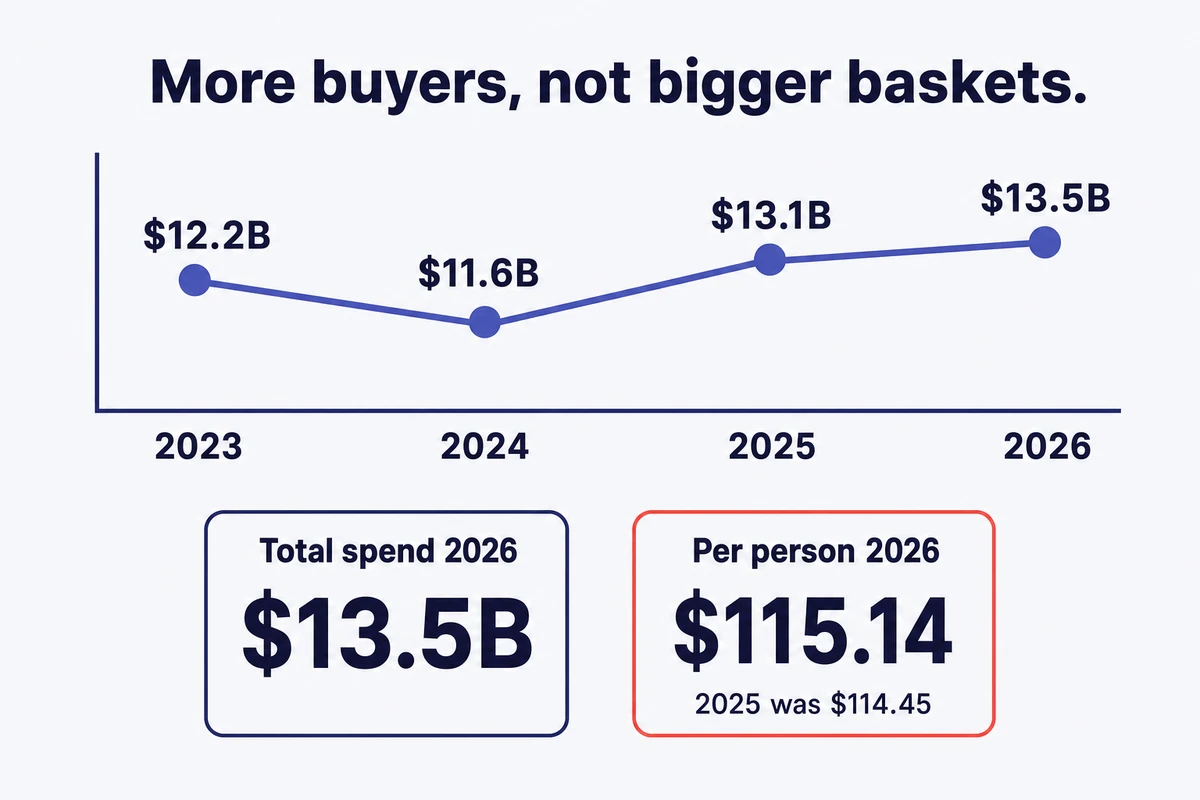
Per the NRF’s 2026 Halloween survey, US consumers are expected to spend $13.5 billion on Halloween this year. Per person, that’s $115.14, versus $114.45 in 2025. And 74% say they’ll celebrate, up a touch from 73%.
Now, here’s the honest read on that.
Total spend went up. Per-person spend basically didn’t. The growth is coming from more people participating, not from each person spending meaningfully more. So if you’re planning inventory on a story about buyers loosening up, that story isn’t in the data. Volume is growing; basket size is flat.
The survey covers 7,889 consumers, ran September 1 to 9, and carries a margin of error of plus or minus 1.1 points. Worth knowing, because a one-point move between years is noise, not a trend.
One more thing the number hides: only 27% of consumers plan to shop online for Halloween, down from 31% in 2025. Discount stores lead at 39%, specialty Halloween and costume stores draw 32%, and local and small businesses 13%. Shoppers could name more than one, so these are shares of people, not of dollars, and the NRF doesn’t say how much of the $13.5 billion is spent online.
💡 Expert Tip: Don’t size your Halloween buy against the headline number. It covers every channel, and only 27% of shoppers plan to buy online at all. Treat that as a rough brake on your plan, not a formula: start from your category’s spend and scale down. Sellers who anchor on “$13.5 billion” tend to over-order, and Halloween inventory has the shortest possible window to clear.
Amazon Halloween best sellers by category
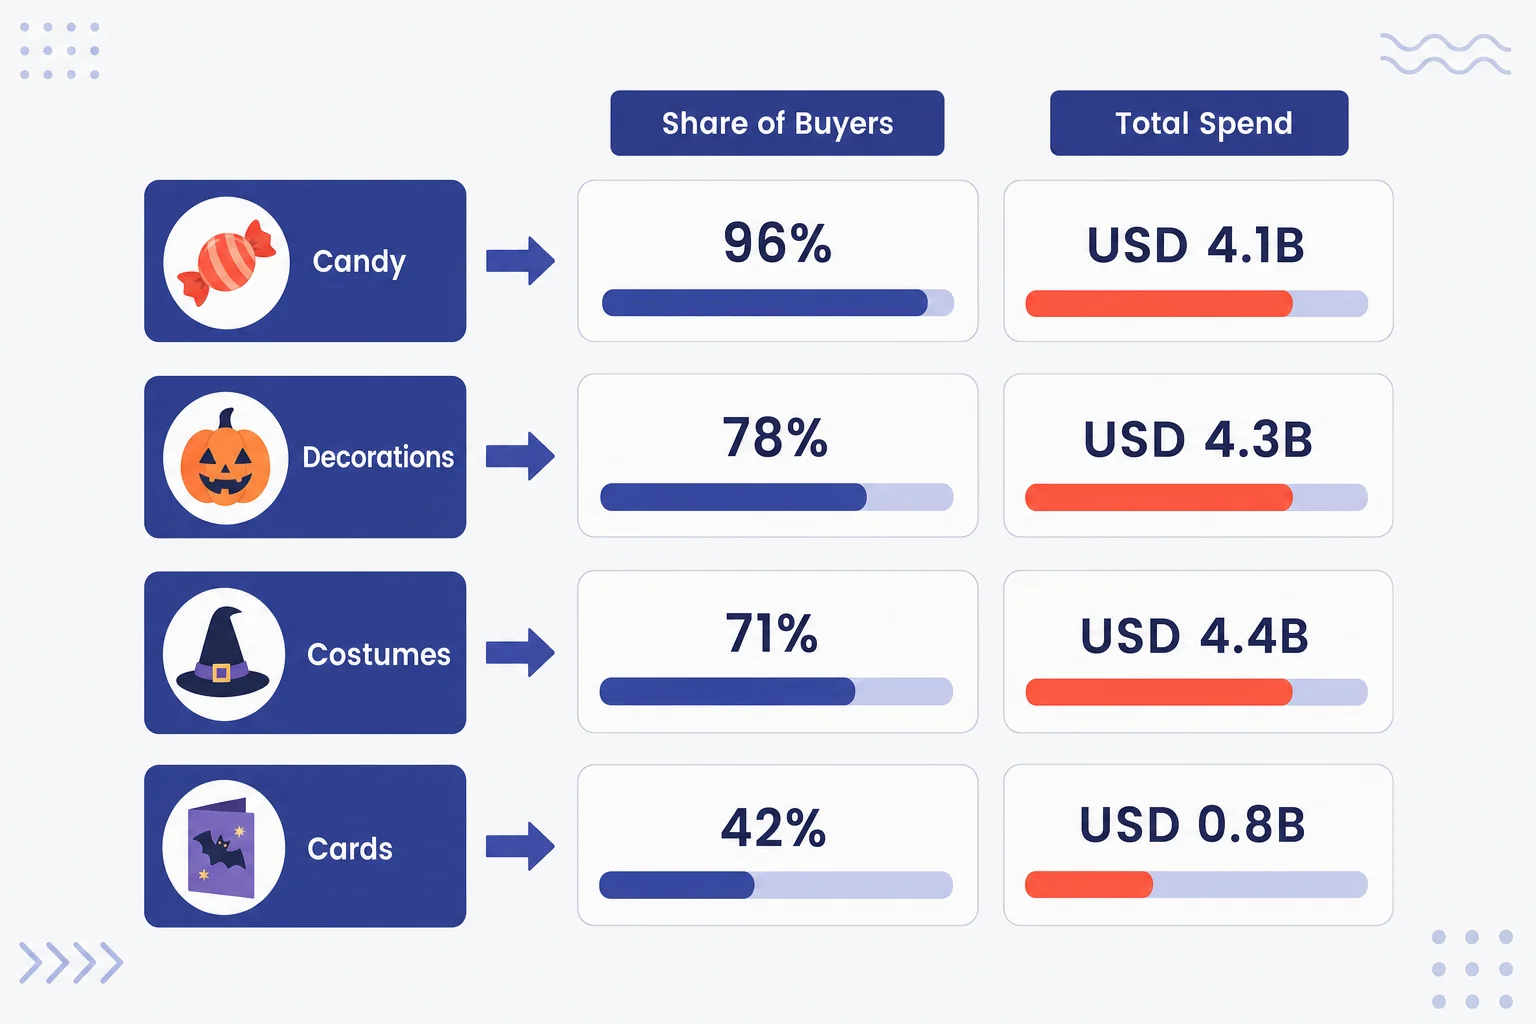
The four Halloween categories behave very differently, and the gap between “how many people buy it” and “how much they spend” is where the opportunity sits.
| Category | Share of buyers | Total spend |
|---|---|---|
| Candy | 96% | $4.1 billion |
| Costumes | 71% | $4.4 billion |
| Decorations | 78% | $4.3 billion |
| Greeting cards | 42% | $0.8 billion |
Read that table twice. Candy has near-universal participation at 96% and the lowest spend of the big three. Costumes have the fewest buyers at 71% and the highest spend at $4.4 billion. Those are different businesses entirely.
Candy is a volume game against grocery and discount pricing, and it’s the category where Amazon is least likely to be the default. Costumes carry the highest revenue per buyer, but they come with sizes, variants, and a return rate that shows up in November. Decorations sit in a genuinely nice spot: $4.3 billion, 78% participation, and mostly simple SKUs with no sizing.
Greeting cards are small at $0.8 billion, but participation moved from 38% to 42% in a year. That’s the fastest-growing slice on the list. Small base, real movement.
Half your buyers shop in September or earlier
This is the finding I’d tattoo on a seller’s forearm if they let me.
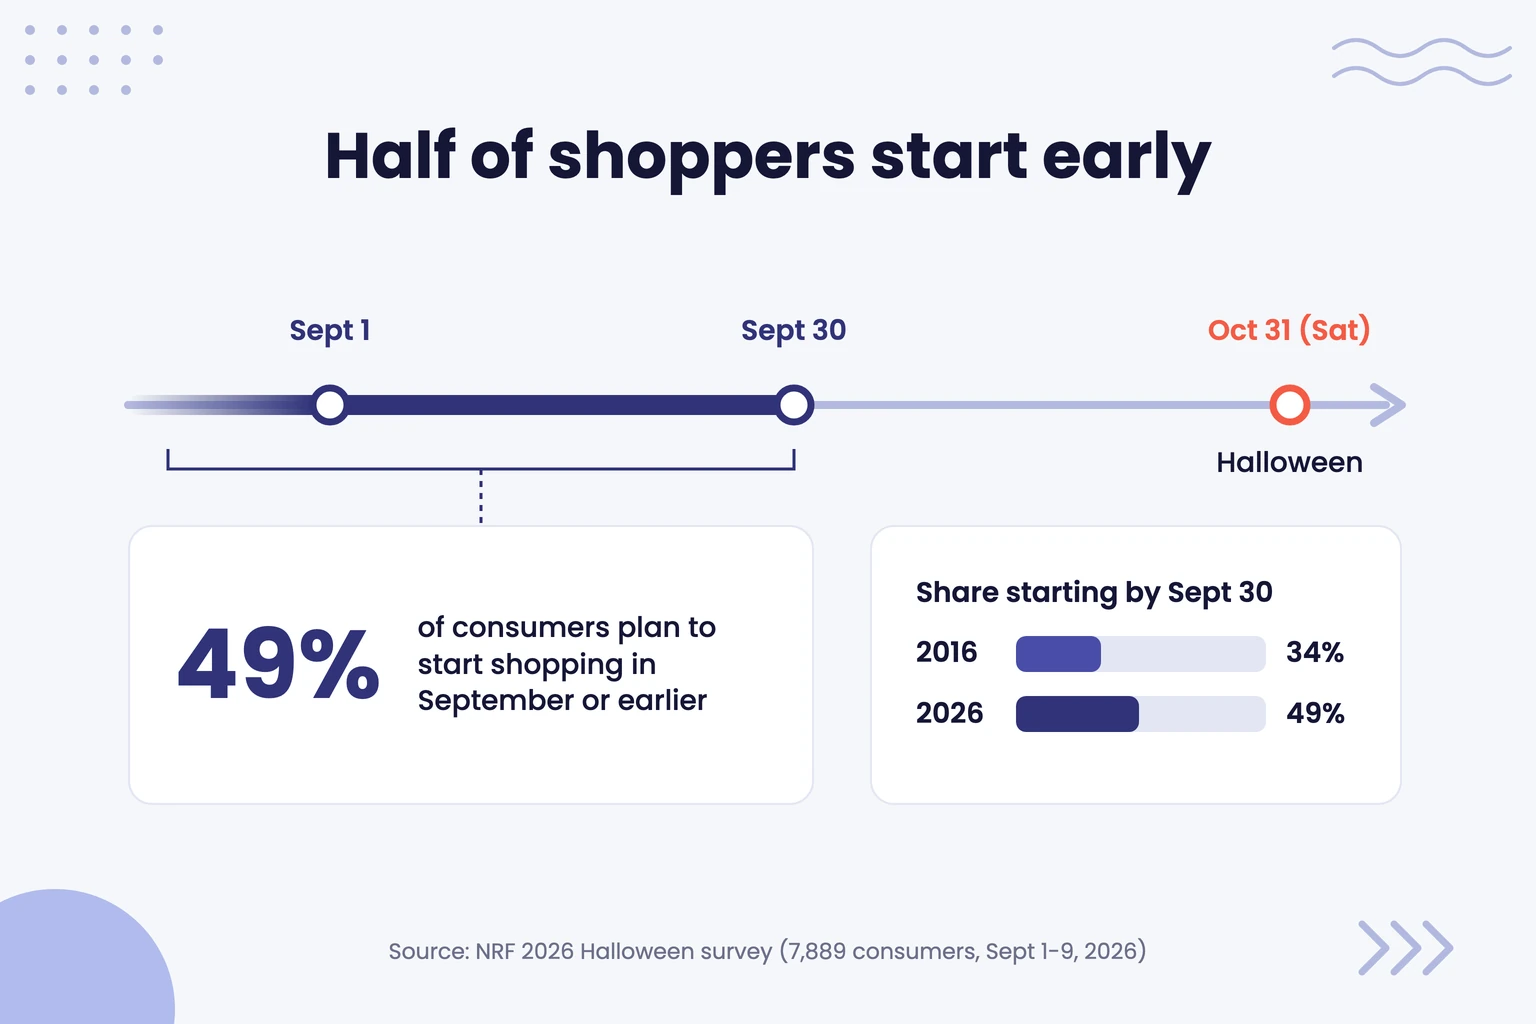
About half of consumers (49%) say they start Halloween shopping in September or earlier, on par with 2025. In 2016 that figure was 34%. Over that decade the season quietly moved forward by weeks, and a lot of seller behavior hasn’t moved with it.
What that means in practice: your listing needs to be finished in August. Not live. Finished. Images optimized, title and bullets settled, reviews accumulating, keyword rankings established. By the time you’re making changes on October 10, the early half of the season has already been decided, and you’re editing a listing while it’s being judged.
Two things I’d rather you do instead. Get your pricing and content locked before Labor Day. Then spend September watching, not editing.
🎯 Pro Insight: If you sell Halloween SKUs, treat September 1 as your Halloween listing deadline, not October 1. Track your target keywords from mid-August so you can see whether you’re gaining or losing ground while demand builds. Our keyword rank tracking exists largely because seasonal sellers kept asking for exactly this window.
The Halloween costumes buyers actually name
The NRF asks consumers what they’re actually dressing up as, and the answers split into classic archetypes and licensed characters.
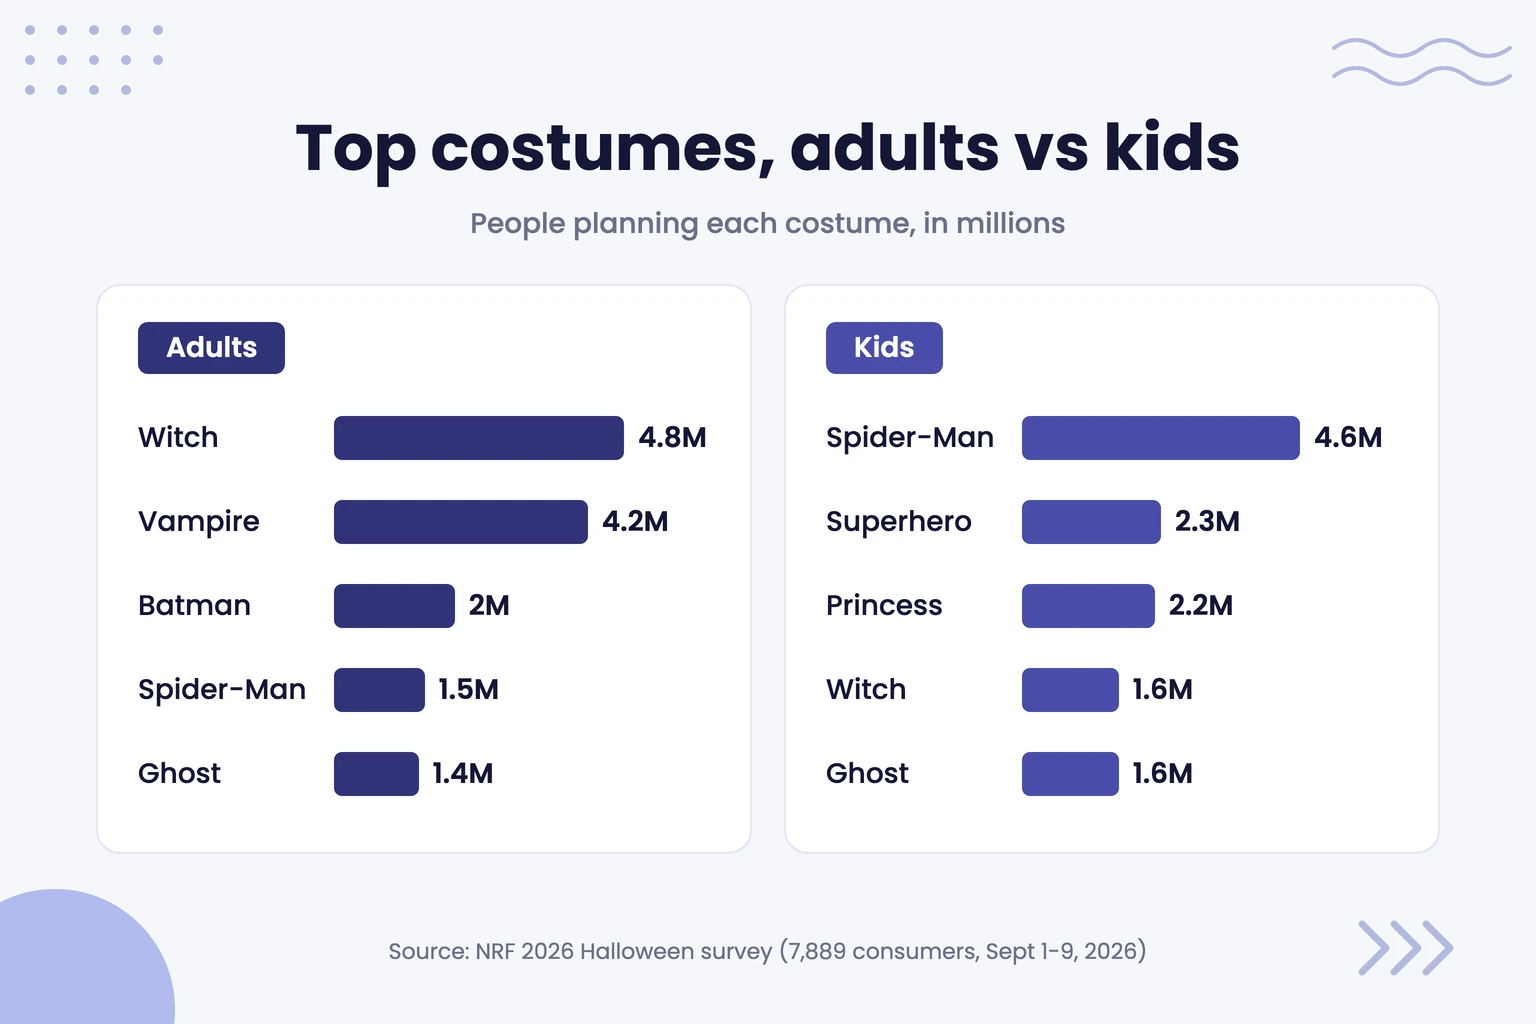
For kids: Spider-Man leads at 4.6 million, followed by superhero at 2.3 million, princess at 2.2 million, and witch and ghost at 1.6 million each. For adults: witch at 4.8 million and vampire at 4.2 million, then Batman at 2 million, Spider-Man at 1.5 million, and ghost at 1.4 million. Pet costumes are their own market at $0.92 billion, and the single most popular pet costume is a pumpkin at 11.6%.
Notice what moved. Kids’ Spider-Man doubled from 2.3 million in 2025 to 4.6 million, so a licensed character can dominate the list. That cuts both ways. Spider-Man sells hugely, but only under license: it’s licensed Marvel IP, and unlicensed listings risk IP takedowns, often mid-season. Batman is licensed too. Witch, vampire, and ghost are generic archetypes that need no license, which makes them the safe inventory bet for most sellers.
I’d be cautious with anything pegged to a specific film or show. The upside is real but the downside is a warehouse full of last year’s reference nobody gets anymore.
Nearly half of shoppers are using AI to decide
Here’s a finding that didn’t exist on this list a few years ago: 47% of consumers say they use AI tools for Halloween shopping. Top uses are brainstorming ideas (34%) and asking for product recommendations (32%).
That changes what a good listing looks like. An AI assistant reading your product page doesn’t respond to a moody lifestyle photo. It reads the title, the bullets, the attributes, and the structured data. If your size chart lives only inside an image, an AI can’t quote it. If your bullets are marketing adjectives instead of specifications, there’s nothing concrete for a model to recommend on.
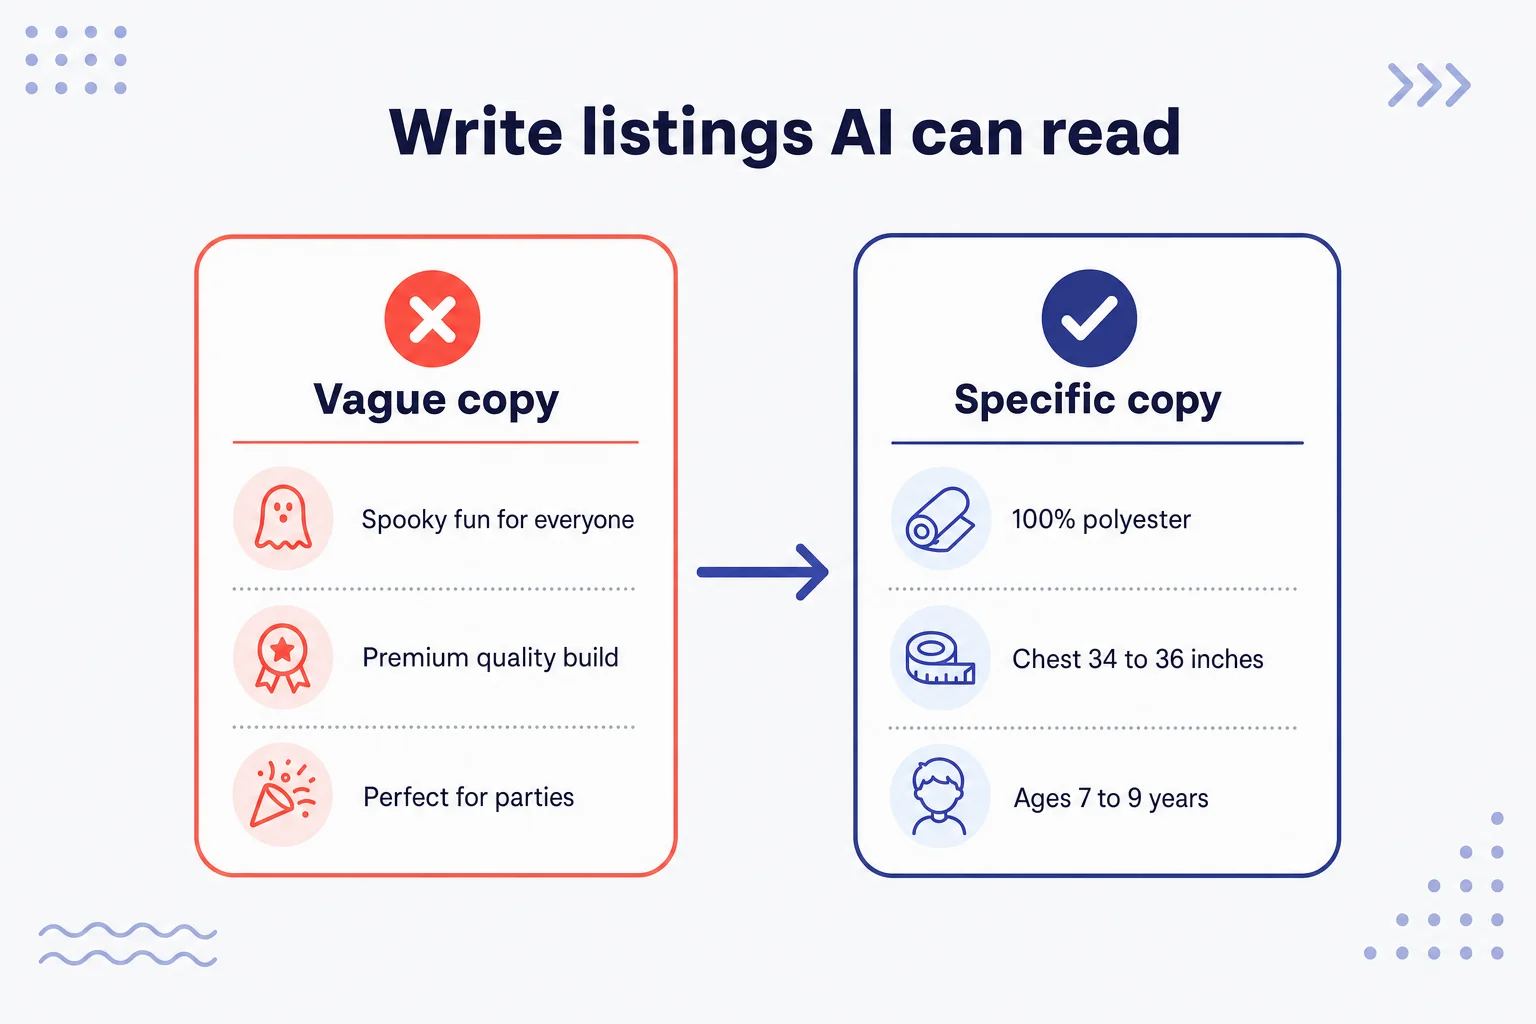
Plain, specific, factual copy is now doing double duty: it converts humans and it gives machines something to cite. That’s the same advice as always, honestly. There’s just a new reason it matters.
What breaks when Halloween traffic spikes
This is the part where I’m less cheerful.
Traffic surges attract attention you don’t want. From what we see across seller accounts every Q4, the pattern is consistent: listings that suddenly rank and sell get noticed, and a few predictable things go wrong at the worst possible moment.
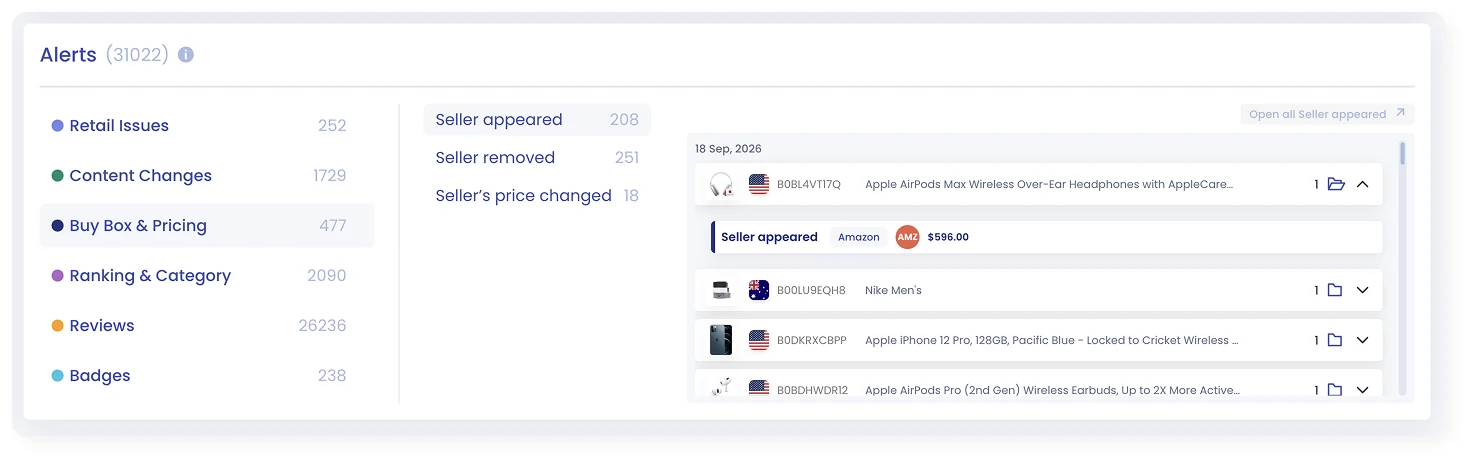
- Unauthorized sellers attaching to your ASIN. A listing climbing the Halloween best sellers charts is an advertisement to hijackers. They show up for the traffic, undercut you, and disappear in November, leaving you with the bad reviews.
- Buy Box loss during peak hours. Somebody undercuts by a few cents on October 28. If you find out on the 30th, the season’s over.
- Listing suppression at the worst time. A missing attribute or an image that fails a check can suppress a listing on the busiest weekend of the season. Amazon doesn’t call you about it.
- Variants selling out unevenly. The medium sells through, the listing keeps ranking, and buyers land on an out-of-stock size and bounce. Your conversion rate takes the hit.
- Price changes you didn’t make. Repricers, competitors, and Amazon’s own behavior all move faster in Q4.
None of that is exotic. It’s the ordinary stuff, compressed into five weeks where every hour costs more than it does in February.
📌 From Our Experience: The seasonal incidents that cost the most aren’t the dramatic ones. They’re the quiet ones that ran for three days because nobody was looking on a weekend. In Q4 the cost of a slow response goes up sharply, simply because the traffic behind the problem is bigger. That’s the whole argument for automating the watching rather than scheduling it.
If you want the deeper version of this, our guide to Amazon listing monitoring covers what to watch and why manual checks stop scaling. For the hijacker-specific playbook, the brand protection guide goes further than I can here.
After October 31: the reset nobody plans for
Halloween inventory has a cliff, not a slope. On November 1 your seasonal SKUs go from peak demand to near zero, and the competitive behavior around them changes overnight.
Three things worth doing in that first week of November.
- Watch the price race to the bottom. Everyone with leftover stock discounts at once. If you’re repricing automatically, check your floors before the 1st, not after.
- Audit what the season did to your listing. Seasonal traffic brings seasonal reviews, and a rush of one-star “arrived after Halloween” feedback can outlive the holiday by months.
- Write down what actually sold. Sizes, variants, timing, the week demand turned. Next August that note is worth more than any trend article, including this one.
Then set your Buy Box and pricing alerts to keep running through the clearance window. The season’s over for buyers. It isn’t over for your margin. Black Friday follows on November 27, and our Amazon seller holiday calendar lists every date from there to Christmas.
Bottom line
Amazon Halloween best sellers in 2026 come down to a handful of facts worth holding onto:
- $13.5 billion total, but flat per person. More buyers, not bigger baskets. Plan volume, not premium.
- Only 27% of shoppers plan to buy online. That’s a share of people, not of spend, so use it as a rough brake on the headline, not a formula.
- Costumes carry the highest spend, decorations the best ratio. $4.4 billion versus $4.3 billion, but decor has more buyers and simpler SKUs.
- Half of buyers start in September or earlier. Your listing should be finished in August and watched in September.
- Archetypes are the safe stock. Witch and vampire need no license. Spider-Man sells hugely, but only under license.
Final Expert Recommendations:
Based on what we see across seller accounts every Q4, the thing that separates a good Halloween from an expensive one usually isn’t the product choice. It’s whether anyone noticed the problem while it was still small. Detection is the gate; everything else is recoverable. If you’re just getting started, pick your three highest-revenue seasonal ASINs and set alerts on those well before the last weekend of October, because those three are where a quiet three-day incident does the most damage.
Want alerts running before the Halloween rush? Start a free 14-day SellerSonar trial and monitor 5 ASINs and 10 keywords, no credit card required. If a hijacker lands on a tracked ASIN or you lose the Buy Box on the last weekend of October, you’ll know on the next check (every hour on Business and Enterprise).
Sources: NRF 2026 consumer survey (7,889 respondents, September 1 to 9, 2026, ±1.1 points) and the NRF 2025 survey for year-over-year comparisons. All figures are US consumer data in USD.

