






Quick Answer
To track Amazon sales trends, work from Amazon’s own free data rather than someone else’s annual list. Best Sellers shows what has sold over roughly the last 30 days, Movers & Shakers shows the biggest sales-rank gains in the past 24 hours, and Product Opportunity Explorer shows search volume, saturation, and seasonality for a whole niche. Cross-check anything you find against off-Amazon demand, then watch it for a full season before you commit inventory. A spike and a trend look identical for about two weeks.
About the Author: Gloria Anderson is an Amazon Brand Protection Specialist with 9 years of experience helping private label brands and distributors protect their pricing policies on Amazon. She has worked with brands managing 50 to 2,000+ resellers and has seen firsthand what happens when MAP enforcement is reactive instead of proactive.
Let’s start with something a bit awkward.
This page used to be a list of trends for a year that has since come and gone. It named five things to watch, quoted a few forecasts, and told you to get ahead of them. The forecasts have since resolved, the year ended, and the list stopped being useful roughly twelve months after it was written.
That’s the problem with trend lists generally, and it’s worth saying out loud before you read another one. By the time a trend is confident enough to appear in an article, it’s usually visible to everyone else too.
So this is the other version of the article: not what’s trending, but how to see it yourself, in the data Amazon already gives you free. That skill keeps working after the year on the headline changes.
Why Trend Lists Go Stale So Fast
A published trend has already been through a slow pipeline. Someone notices a pattern, checks it, writes it up, waits on an editor, publishes. That’s weeks at best. By then the early movers are stocked and your supplier quote is worse.
There’s a second problem, which is that most trend content is written to be readable rather than actionable. “Social commerce is growing” is true, and it’s been true every year for a decade. It tells you nothing about whether to buy 500 units of anything.
The signals that actually move a purchasing decision are narrower and duller: how many people searched a term last month, how that changed, how many sellers already serve it, and what happens to that demand in February. Amazon publishes most of that.
💡 Expert Tip: Treat any trend you read about in an article as a starting keyword, not a conclusion. The useful move is to take the term, put it into the tools below, and see whether the underlying demand curve supports the story. Quite often it doesn’t, which is a genuinely valuable thing to find out before you commit.
The Free Signals Amazon Already Gives You
Four of them. Three are free to anyone, the fourth needs Brand Registry, and most sellers I talk to use exactly one.
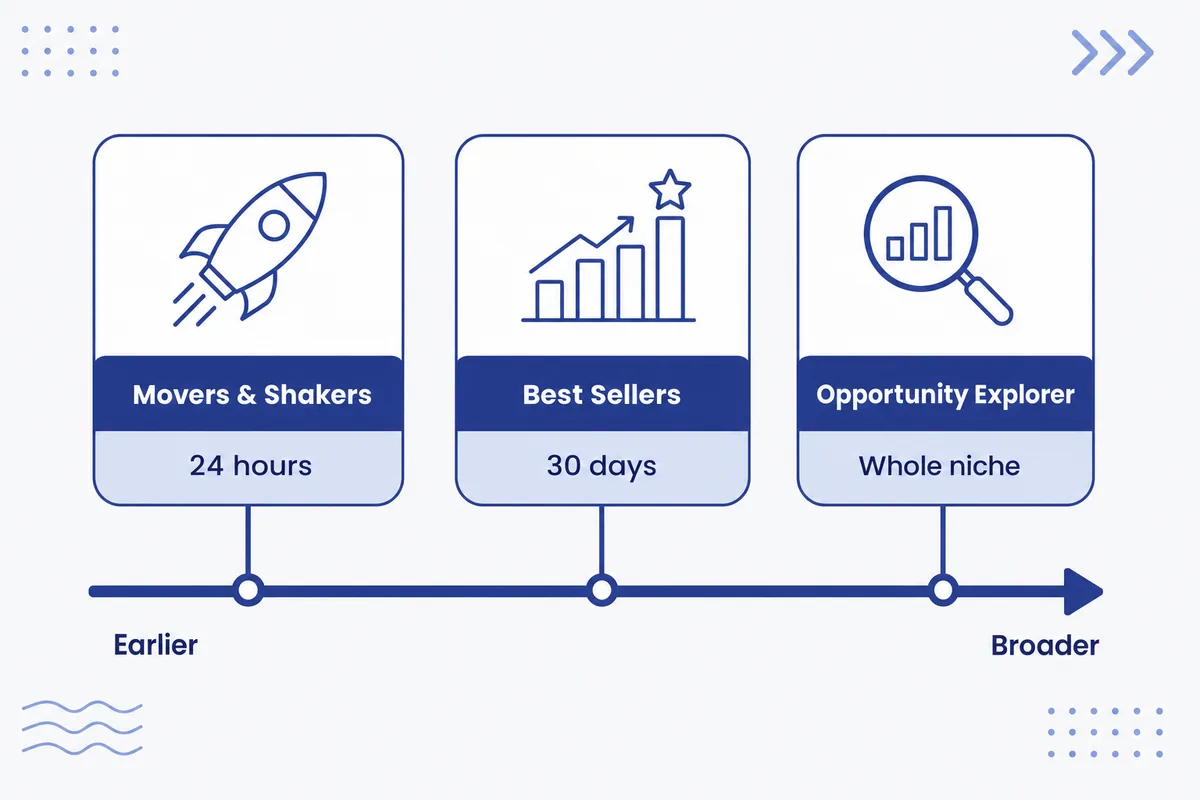
Best Sellers ranks the top products per category over a trailing window of roughly 30 days. It’s a lagging indicator by design. Useful for reading an established market. Close to useless for catching anything early.
Movers & Shakers is the one worth a daily look. Amazon’s own page describes it as the biggest gainers in sales rank over the past 24 hours, and it refreshes through the day. Amazon explains the math on the page itself: an item ranked 10 today that sat at 30 a day ago shows a 200% increase. Two practical notes. The list is rendered in the browser, so it can take a moment to appear. And if you are signed in to an Amazon Business account you may get the heading and the department filter with no products underneath at all; sign out, or use a consumer account, and it fills in. Where Best Sellers shows you who’s winning, Movers & Shakers shows you what changed overnight, which is much closer to what you actually want.
Product Opportunity Explorer is the serious one, and it gets its own section below.
Brand Analytics gives brand-registered sellers the search-frequency rank for terms in your categories, plus the top clicked and converting ASINs behind each. If you’re registered and not reading it, that’s the highest-return hour on this page.
Side by side, they answer different questions:
| Signal | Window it covers | Best for | Access |
|---|---|---|---|
| Best Sellers | Trailing ~30 days | Reading an established category | Public |
| Movers & Shakers | Past 24 hours | Catching a move early | Public |
| Product Opportunity Explorer | Niche level, including seasonality | Validating before you buy | Professional account |
| Brand Analytics | Search frequency rank by term | Seeing which ASINs win a term | Brand Registry only |
A caution on all four: they describe Amazon, not the world. A category can be growing fast on Amazon while shrinking everywhere else, and the reverse happens too.
Product Opportunity Explorer Deserves an Hour
This is Amazon’s own demand-research tool, and in my experience it’s the single most underused thing in Seller Central. You’ll find it under the Growth menu, and it needs a Professional selling account, which runs $39.99 a month plus selling fees.
What it shows is a niche rather than a product: a cluster of search terms grouped by how customers actually browse and buy. For each one you get search volume and the top terms driving it, how saturated the niche already is, what reviews say customers keep complaining about, return activity, pricing movement, and seasonality.
That last pair is why it beats a trend list. Return activity tells you where demand exists but the products are bad, which is the most useful gap there is. Seasonality tells you whether the curve you’re excited about is a trend or a calendar.
On its own page for the tool, Amazon claims products launched with these insights have “2.5x higher sales potential in their first three months”, based on internal data across the US, Europe, and Japan. Treat a vendor’s own number with the caution it deserves. But the underlying data is Amazon’s first-party purchase behavior, and nothing a third-party tool infers from the outside is going to be closer to the truth than that.
If you’d rather compare what’s available before committing, we keep a separate breakdown of the best Amazon product research tools, including where the paid ones genuinely add something over Amazon’s free data.
Check It Somewhere Other Than Amazon
On-platform data has one blind spot: it only shows you demand that already found Amazon.
Google Trends is the cheapest cross-check there is, and it takes about 90 seconds. If a term is climbing on Amazon and flat on Google, you’re probably looking at share shifting between sellers rather than a market growing. If it’s climbing in both, that’s a real signal. And if it’s climbing on Google but barely registers on Amazon, that’s occasionally the most interesting case of all: demand that hasn’t arrived on the platform yet.
Social platforms are noisier but faster. A product going around TikTok shows up there weeks before it reaches Movers & Shakers. The catch is that most of it never converts into durable demand, so treat it as a watchlist rather than a buy signal.
🎯 Pro Insight: Run the same term through Amazon search volume and Google Trends on the same afternoon and write both numbers down. The gap between them is the part worth thinking about. I’ve seen sellers talk themselves into a category purely on Amazon-side growth that turned out to be one competitor’s ad spend.
Telling a Real Trend From a Two-Week Spike
Here’s where most of the money gets lost, and it isn’t on the products people miss. It’s on the ones they catch too late.
A spike and a trend look identical at the start. Rising rank, rising search volume, rising prices. They only separate later, and by then you’ve either ordered or you haven’t.
Two weeks. That’s roughly the window where the two are indistinguishable.
A few things that help:
- Look for a second season. If the curve did something similar this time last year, it’s seasonal, not new. The Amazon seller holiday calendar covers the recurring ones.
- Check whether supply is following. If the number of sellers on those listings is climbing as fast as demand, your margin window is already closing.
- Look at review velocity, not just review count. A niche where the top listings are all recent, with reviews arriving quickly, is a market still forming. Old listings with slow review accrual is a market that’s settled.
- Ask what drove it. A product that spiked because one video went viral behaves very differently from one that rose because a category shifted.
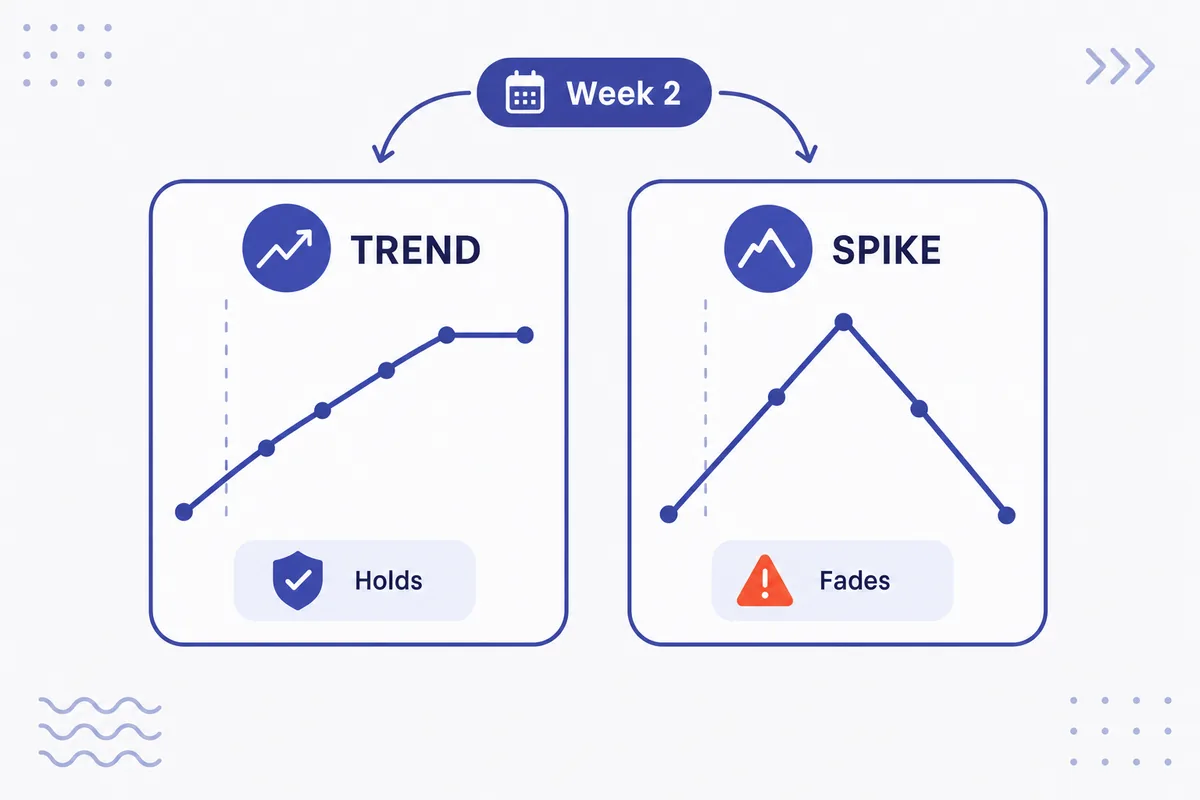
Honestly? The strongest filter is patience. Watching a curve for another month costs you nothing except the deals you’d have got wrong.
What It Costs to Be Wrong
Trend chasing has an asymmetry that rarely gets mentioned. Missing a trend costs you the profit you didn’t make, which feels bad but shows up nowhere. Catching a fake one costs you actual money: the units, the storage, and eventually the removal or disposal fees.
So run the margin before the story. If a product only works at a price that assumes the trend holds, it’s not a plan, it’s a bet. Our free FBA calculator will give you the fee side, and it’s worth doing that math before you fall in love with a category rather than after.
Worth being honest about scope, too: not every seller should be chasing new categories at all. If you already have products that work, deepening those usually beats adding a fifth. Our guide on what to sell on Amazon goes into that decision properly.
Watching a Trend After You Commit
Spotting it is the first half. The half that determines whether you keep the margin is what happens over the following weeks.
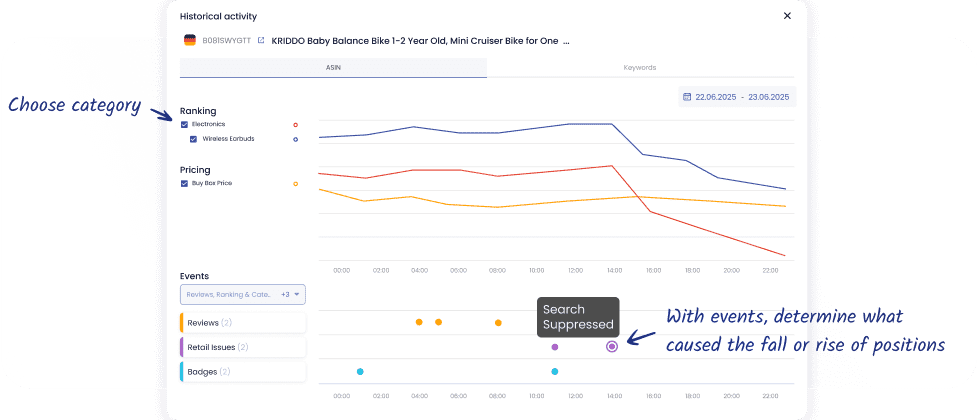
When a niche heats up, several things move at once and none of them notify you:
- Sales rank swings, which is your earliest read on whether demand is holding or fading
- New sellers arriving on your ASIN, because a visibly growing listing attracts company
- Price erosion, as those sellers compete on the only lever they have
- Listing changes, since a busy category tends to attract more of Amazon’s attention as well
Rank first. Always. Tracking sales rank over time turns a vague feeling that things are slowing into an actual date you can point at, which is usually when you want to stop reordering.
📌 From Our Experience: Set up the monitoring before the inventory arrives, not after the first bad week. Sellers who wait tend to discover a price collapse when they look at a payout report, which is often three weeks after it started. Ranking and BSR monitoring closes that gap to a notification.
One more thing worth knowing if you’re driving outside traffic into a new category: Amazon’s Brand Referral Bonus pays a bonus averaging 10% of qualifying sales back to you on orders that came from your own off-Amazon marketing. Three requirements: a Professional plan in the US store, Brand Registry, and traffic tagged through Amazon Attribution. For a category you’re deliberately building demand in, that’s a meaningful chunk of the referral fee back.
Conclusion
Reading Amazon sales trends yourself is a slower skill than reading a list, and it’s the one that keeps working. Best Sellers tells you what’s established, Movers & Shakers tells you what moved overnight, and Product Opportunity Explorer tells you whether the demand underneath has room in it.
The discipline is in the second step, not the first. Cross-check off Amazon, look for last year’s version of the same curve, and check whether supply is arriving as fast as demand before you decide anything.
Then watch it. A category that looked great in month one and quietly filled with competitors by month three is the ordinary outcome, not the unlucky one.
Final Expert Recommendations:
Based on what we see going wrong, the most common failure isn’t picking the wrong trend, it’s picking a real one too late and paying full price for the inventory. If you take one thing from this page, make it the seasonality view in Product Opportunity Explorer, because it answers the single question that separates a trend from a calendar. If you’re just getting started, ignore trend hunting for your first year entirely and get better at the products you already sell. And whatever you chase, set up rank and price monitoring on it before the stock lands, so the moment the curve turns is a notification rather than a discovery.
Want to see a category’s rank and price movement without checking it by hand? Sign up for a free 14-day trial.

